Reports
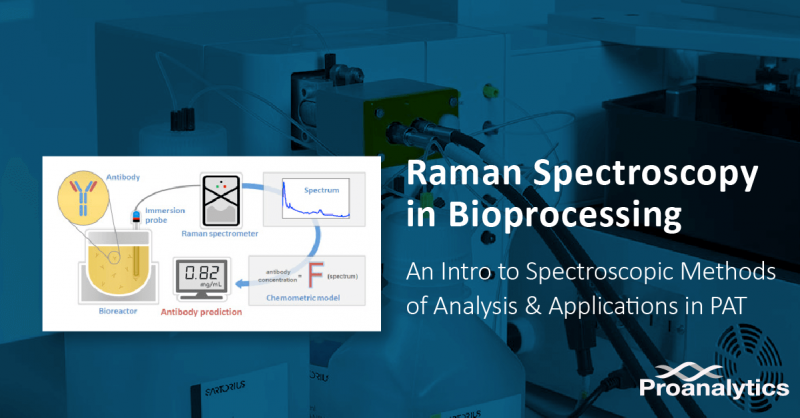
Raman Spectroscopy in Bioprocessing: An Introduction to Spectroscopic Methods of Analysis & Applications in PAT
Aug
Introduction
The release of the FDA’s guidance on process analytical technology (PAT) for the biopharmaceutical industry has encouraged the industry to gear towards adaptive processes that ensure consistent product quality through advanced control strategies. Adoption of PAT has become very crucial as the bioprocess industry has grown rapidly over the past two decades [1]. The development and optimization of bioprocesses are now more analytical as several new technologies, including Raman spectroscopy, enabled accurate and detailed real-time monitoring of bioprocesses. One of the novel non-invasive real-time process monitoring techniques that boomed is spectroscopy and – more specifically – optical spectroscopy, as more powerful light sources (mainly lasers) and reliable detectors have been developed.
Please download our Raman Spectroscopy Technology Introduction for a quick introduction to the technology, common upstream and downstream applications in bioprocessing, and Tornado Spectral Systems’ high-throughput virtual slit technology principles and its advantages.
What is spectroscopy?
Spectroscopy is the study of the interaction between matter and electromagnetic radiation as a function of wavelength of the radiation. There are different branches of spectroscopy based on the type of electromagnetic radiation that the matter interacts with.
Optical spectroscopy is a subset of spectroscopy, and it is often employed as an analysis technique to measure the interactions of different wavelengths of light with matter to determine the physical and chemical properties of the sample with which light is interacted, hence it provides a unique “fingerprint” for different atomic, molecular, and crystal structures in a sample [2]. Variations in the atomic and molecular structures result in different spectroscopic fingerprints, and optical spectroscopy can be used to identify and quantify these structures.
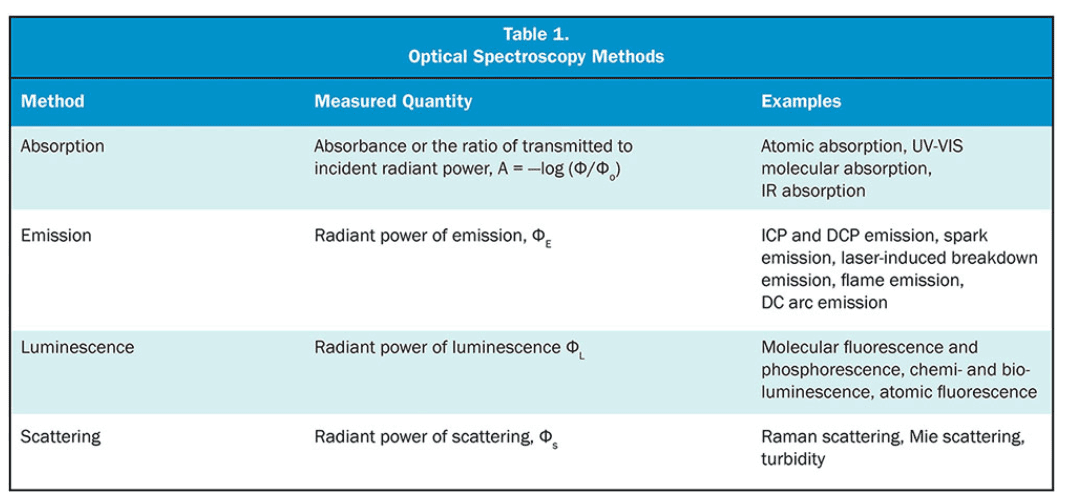
Optical spectroscopy can be divided into several branches as well, but the most employed classes in the bioprocessing field are
- Luminescence spectroscopy,
- Absorption spectroscopy (including NIR spectroscopy), and
- Raman spectroscopy (Spectroscopy using the inelastic scattering of photons).
Spectroscopic Techniques: Introduction to Spectroscopic Methods of Analysis in Bioprocessing
Luminescence Spectroscopy
The most common method of luminescence spectroscopy is fluorescence spectroscopy, where the fluorophore is excited to a higher energy state by an incident photon and then emits light at different wavelengths than the incident wavelength by dropping to a lower energy state. Different fluorophores have different emission spectra, and this method can collect information on fluorescent compounds in the sample.
Absorption Spectroscopy (NIR Spectroscopy, UV/Vis Spectroscopy)
The most common method of absorption spectroscopy is near-infrared spectroscopy (NIRS or NIR spectroscopy). The absorbance of incident light in the near-infrared region of the spectrum (wavelengths from 780 nm to 2500 nm) differs from molecule to molecule, which yields a unique spectrum within the NIR region of light due to Beer-Lambert Law that relates the attenuation of light to the absorptivity and concentration of the sample through which the light is traveling.
Near-infrared spectroscopy instrumentation measures combinations and overtones of molecular vibrations generated due to the change in dipole moment of a molecule with covalent hydrogen bonds (C-H, O-H and N-H bonds). The changes in the dipole moment of covalent hydrogen bonds result in broad and overlapped bands as typically there are multiples of these bonds [3]. Even though NIR spectroscopy has advantages such as a cheaper NIRS device or measurement equipment with the ability to measure absorption through thick container walls thanks to longer path length and much higher signal level for the same number of photons resulting in low exposure times, NIRS does not generate the same level of molecular specificity compared to Raman spectroscopy, which we will discuss next.
Available through PROAnalytics: Prozess Reveal NIR Analyzer
Another common method of absorption spectroscopy is UV/Vis (ultraviolet/visible light) spectroscopy. UV/Vis spectroscopy is also called UV/Vis spectrophotometry. UV/Vis spectroscopy utilizes the ultraviolet and visible ranges of light spectrum, which typically consist of 200 nm – 800 nm range of spectrum. The molecule of concern changes electronic energy state due to absorption of light within UV/Vis range of spectrum.
In order for the absorption to happen, the energy of the incident light must match the energy of a possible transition between electronic energy states of the molecule. The transition happens from a lower energy state to a higher energy state, called excited state. Since different bonds have different energy states, the absorption occurs at different wavelengths of light for different molecules, resulting in different absorbance curves. The degree of absorption is also critical to determine the concentration of the sample, hence quantification of the sample.
UV/Vis spectroscopy and fluorescence spectroscopy are complementary methods, as fluorescence spectroscopy measures transitions from higher electronic energy states to ground electronic energy state, whereas UV/Vis spectroscopy measures from lower electronic energy states to higher electronic energy states. For more information on UV/Vis, please read our article, “Introduction to UV/VIS Spectrophotometry: Using Spectrophotometer To Determine Concentration.”
Raman Spectroscopy (Light Scattering Spectroscopy)
What is Raman spectroscopy?
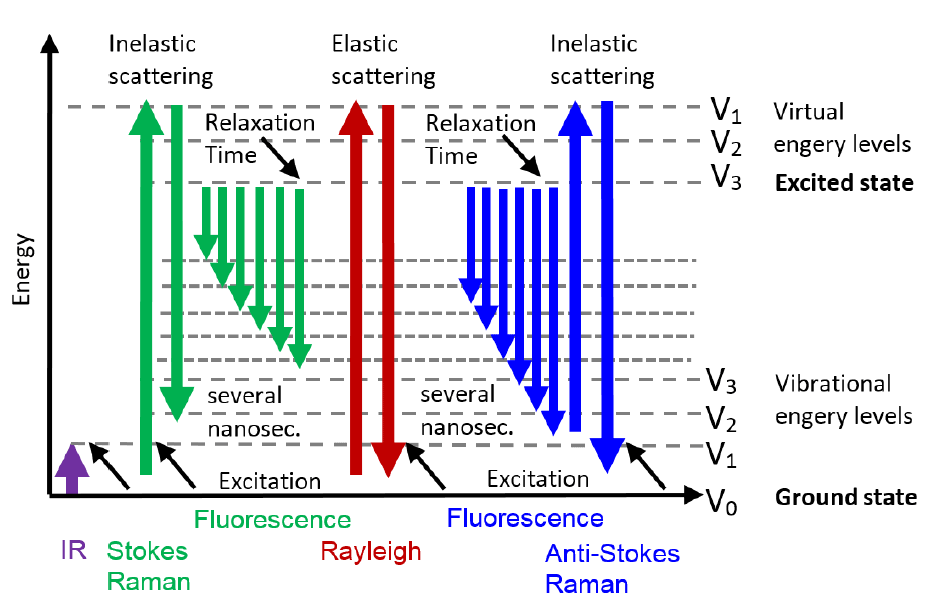
When incident light scatters from the material that it interacts with, the vast majority of the photon scattering happens elastically, which is called Rayleigh scattering. Raman spectroscopy measures the tiny proportion of the photons that are scattered inelastically.
The vibrational state of a molecule can be excited to an energy level above ground state by a photon that loses energy during the Stokes scattering event, or the photon that scatters can gain energy from the drop of vibrational state of the molecule which is called anti-Stokes scattering. These two scattering events are the core of Raman spectroscopy, and Raman spectroscopy yields information of the molecular structure of the sample.
How do Raman and infrared (IR) spectroscopy differ?
Raman spectroscopy is a complementary method to NIRS as it measures a different spectrum of the molecule. NIRS measures the change in dipole moment during the molecular vibrations causing absorption, whereas Raman spectroscopy measures the change in polarizability during molecular motions.
This makes Raman spectroscopy inherently advantageous to measure analytes/metabolites in aqueous solutions/environment as the inelastic scattering spectrum of polar molecules are less efficient than nonpolar ones and the Raman spectrum of water is weaker compared to NIR absorption of water. The weakness of the Raman spectrum of polar molecules results in less interference from polar molecules such as water in the band of concern and facilitates the bioprocess monitoring, cell culture media, and protein analysis.
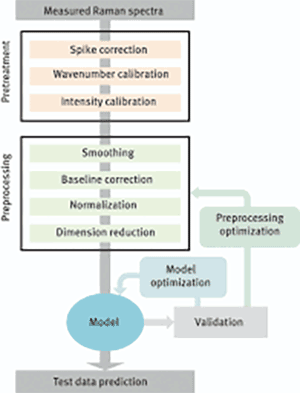
Raman spectroscopy typically requires multivariate data analysis models to be able to work within the intended application. Various denoising and smoothing filters, baseline, spike and scatter corrections, and normalization methods are used to preprocess the experimental Raman spectra data.
Then, calibration and validation data sets are created from the experimental data. Root mean square error on the calibration data and root mean square error on the prediction data are important parameters to check the validity of the model that is built, minimizing these errors with the created model is the goal. Partial least squared, principal component analysis, artificial neural networks and net analyte signal algorithms are commonly employed for the predictions.
Application of Raman Spectroscopy in Bioprocessing
Process Analytical Technology in Upstream Processing
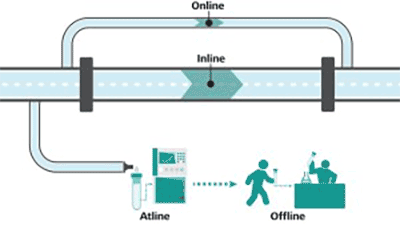
The ability to monitor and control a bioreactor environment is of critical importance to ensure minimal or no deviation from the upstream process strategy as deviations could lead to changes in the properties of molecule. There are four classes of measurements to achieve this objective:
- Inline,
- Online,
- Atline, and
- Offline.
Accurate inline and online measurements provide real time or near real time data. By comparing the targets (or setpoints) to the instantaneous measurement data provided by accurate inline and online measurements, one can take corrective measures to eliminate deviations from the control strategies.
Both atline and offline measurements require sample removal from the reactor to measure parameters by a distant analyzer. Atline measurements refer to the measurements done by analyzers that are close to the reactor, getting measurement data in minutes to hours. Offline measurements result in even longer delays in processing the sample [1]. Hence, in-process control strategies can only be enabled by inline/online measurements.
Some important parameters to measure are cell viability, viable cell density, glucose, amino acid, and product concentration.
Analytical Application of Raman Spectroscopy in Upstream Processing
The final goal of PAT is to integrate different aspects of bioprocessing, such as chemical, physical, mathematical, and biological analyses. Spectroscopic methods are one of the most employed PAT tools, and Raman spectroscopy with the relevant mathematical models is one of the most prominent measurement techniques in monitoring bacterial, yeast, and mammalian cell culture systems including CHO and HEK cells.
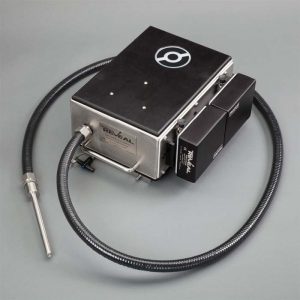
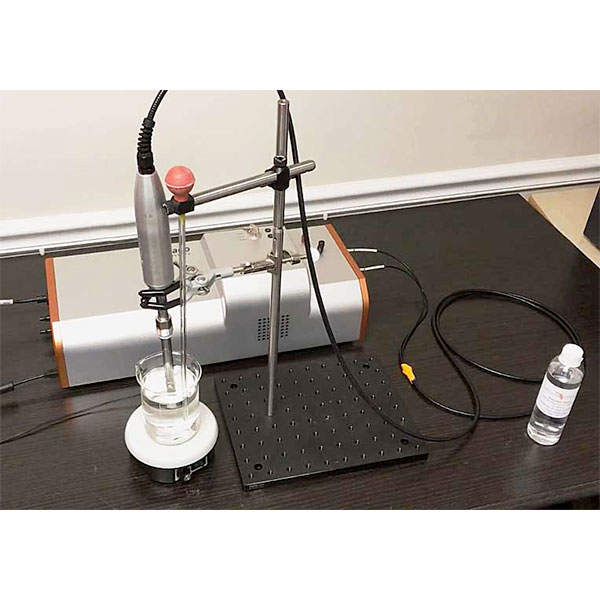
Raman spectroscopy instrumentation is easy to integrate on different setups, such as immersion probes in bioreactors, vessels, and slipstreams, as well as large volumetric probes in manufacturing systems. Raman spectroscopy has an inherent advantage of being able to measure analytes in aqueous environments/solutions due to diminished interference from water, resulting in more accurate measurements than other online and inline spectroscopic and non-spectroscopic analysis techniques.
Inline and online Raman measurements enable process control and corrections from the deviations in real time, therefore increasing process robustness. Since Raman spectroscopy is a noninvasive measurement, it reduces contamination risks and enables remote monitoring of the process.
Strong Raman spectroscopy use cases
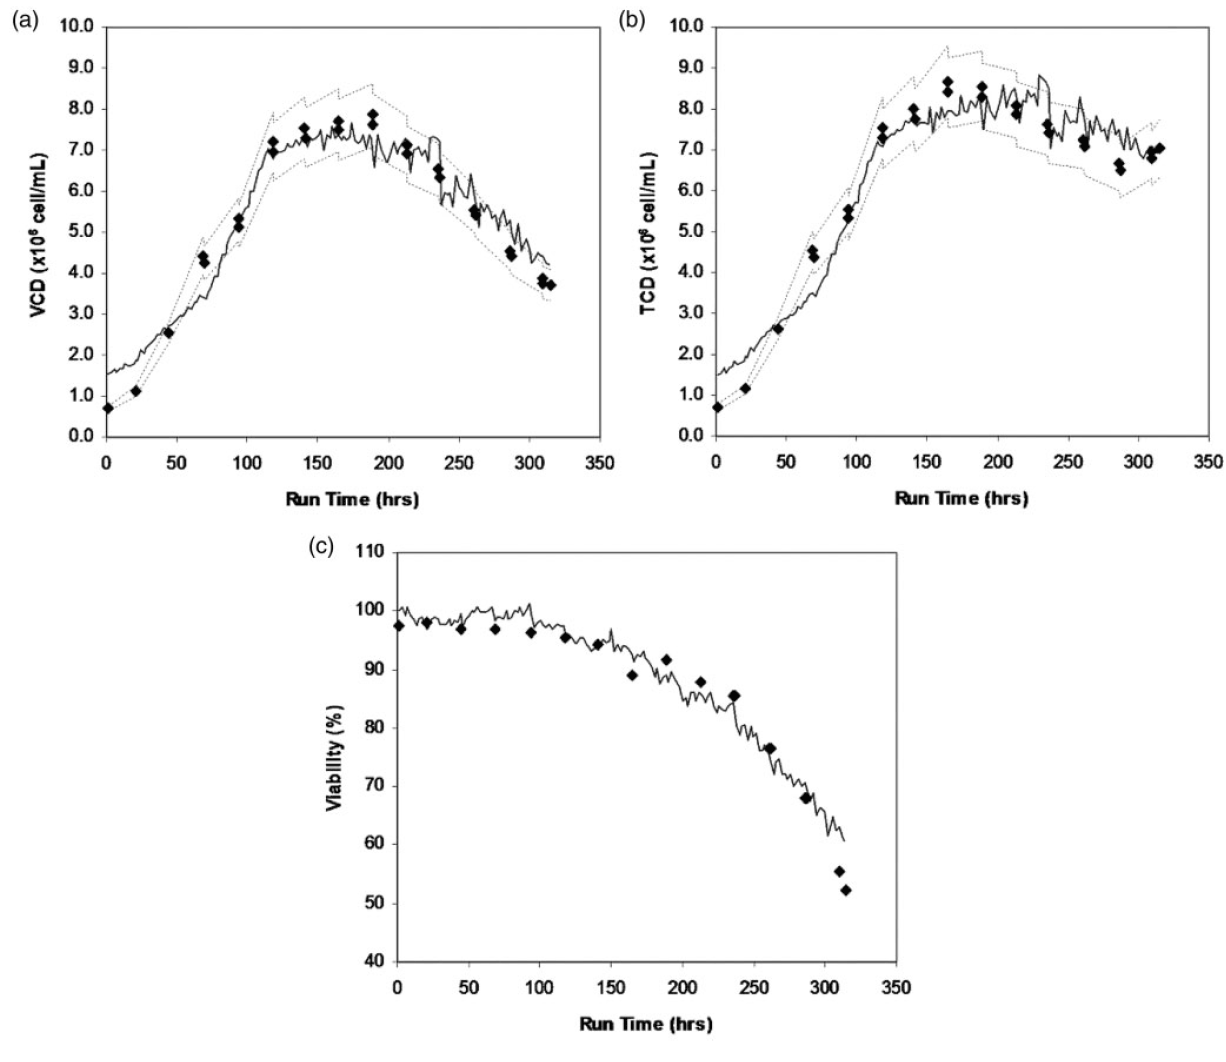
Raman spectroscopy has shown accurate measurements of glucose, lactate, viable cell density, and product concentration leading to adaptive or closed-loop control strategies, such as maintaining glucose concentration at a fixed setpoint or to minimize lactate accumulation by adjusting glucose feed rate.
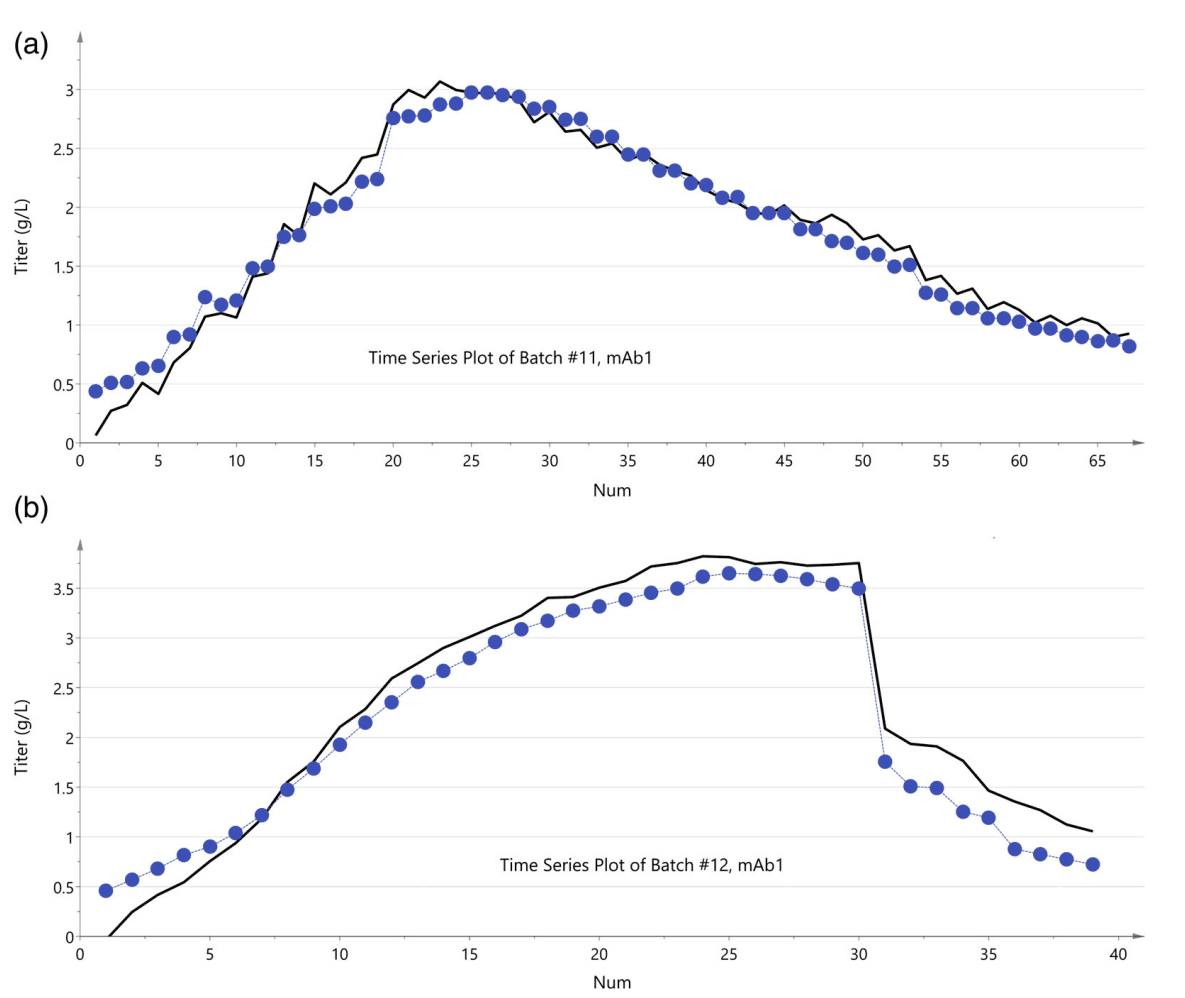
It is also demonstrated that Raman spectroscopy can monitor monoclonal antibodies in real time and distinguish between glycosylated and non-glycosylated molecules. Raman spectroscopy is also shown to have good correlation with traditional offline and atline metabolite analyzers.
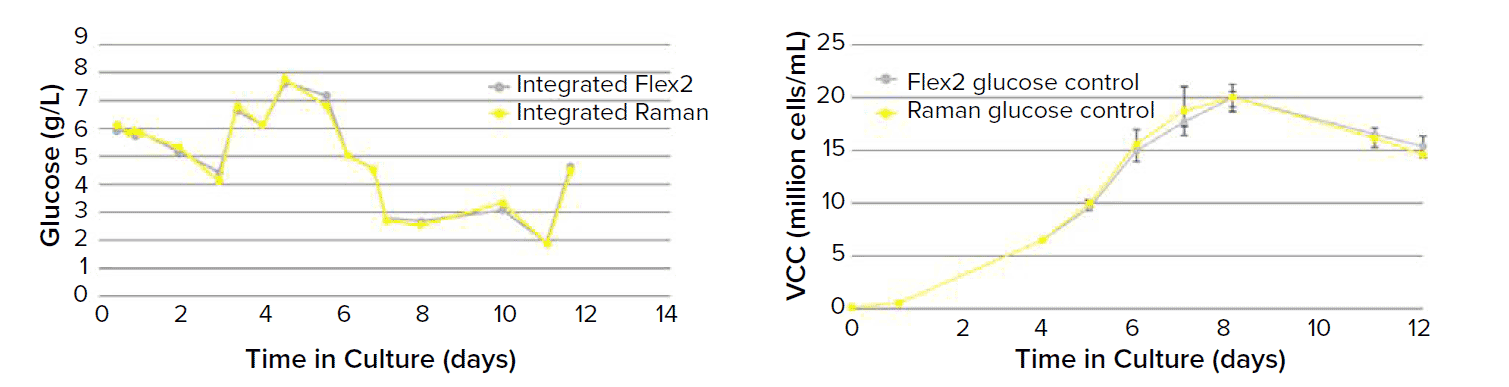
In one study, glucose measurements from Mab-expressing cell line culture by Raman spectrum demonstrated good correlation with reference data from Flex2 analyzer from Nova Biomedical. Raman spectrum based predictive models for glucose controlling the cell culture displayed equivalent glucose and viable cell count profiles compared with the reference data [4]. Other studies show good correlation with HPLC, UV/Visible spectroscopy analyzers and various chemistry analyzers.
The detailed chemical information that is obtained by Raman spectrum thanks to its sharper bands enables further ability of transferring models from small scale R&D settings to large scale manufacturing settings.
It has been demonstrated that Raman spectroscopy could possibly measure below molecules with correct mathematical models [5]:
- Amino acids like alanine, arginine, glutamic acid (glutamate), glycine, histidine, proline, serine, tryptophan, tyrosine, valine, asparagine, glutamine, aspartic acid, cysteine, isoleucine, leucine, lysine, methionine, threonine and phenylalanine;
- DNA and RNA bases like adenine, cytosine, guanine, thymine and uracil;
- Fatty acids and fats like 12-methly-tetradecanoic acid, 13-methylmyrisitic acid, 14-methylmyrisitic acid, 14-methylhexadecanoic acid, 15-methylpalmitic acid, vaccenic acid, glycerol, lauric acid, myrisitic acid, oleic acid, palmitic acid, stearic acid, triolein, trilinolein and trilinolenin;
- Hormones like human growth hormone and insulin;
- Organic acids like acetate, formate, gluconic acid, keto-gluconic acid and lactate; primary metabolites like acetoacetate, acetylcoenzyme a, coenzyme a, fumarate, malic acid, phosphenolpyruvate, pyruvate, citric acid, succinic acid (succinate);
- Salts like magnesium sulfate, nitrate, potassium phosphate monobasic and sulfate;
- Sugars like N-acetyl-d-glucosamine, amylopectin, amylose, arabinose, cellulose, chitin, dextrose, d-fructose-6-phosphate, fucose, galactosamine, lactose, mannose, trehalose, xylose, fructose, glucose and sucrose;
- Some other compounds like β-carotene, ascorbic acid, glutathione and riboflavin.
It is also demonstrated that Raman spectroscopy could measure total cell density, viable cell density, product titer, viability, antibody titer, and osmolality.
Raman spectrum is used in microbial fermentation systems that use Saccharomyces cerevisiae, Gibberella fujikuroi, Lactobacillus casei, Phaffia rhodozyma, Escherichia coli and microalgae, and cell culture systems using CHO, HEK293 and NS0 cell lines [5].
Download Tornado Spectral Systems Application Note: High Throughput Raman Spectroscopy as a Value-Added Means of Accurately Monitoring & Controlling Upstream Bioprocesses (Mammalian Cell Culture)
Upstream Processing Summary
Raman spectroscopy enables the ability to monitor product quality continuously in real time and the development of predictive and advanced feedback control strategies, and upstream process optimization. It displays scalability of prediction models and methods from minibioreactors to large scale production bioreactors. This results in higher process efficiency and production concentration, better and more consistent product quality, shorter cycle times, and lower costs due to reduced need for calibration efforts for different volumes of bioreactors.
Process Analytical Technology in Downstream Processing
Monitoring the critical process parameters (CPP) with various sensors is the main application of PAT in downstream processes. Flow sensors/meters, pressure sensors, pH and conductivity probes, and spectroscopic sensors are some examples of such sensors.
The measurement results are analyzed by univariate analysis and operator knowledge. However, this is typically not enough to have an understanding on critical quality attributes (CQAs) of the product. CQAs include product multimers and product charge variants, host-cell impurities such as host cell proteins, DNA and lipids, and resin leachables. These are typically monitored by atline or online analyses.
Various HPLC techniques are used to monitor high and low molecular weight species content, charge and glycosylation variants, and aggregates; and they are typically employed as atline analytical techniques in downstream processes. The typical monitoring technique for host-related impurities is immunological assays. All these techniques require long analysis times and, even though there has been progress to adapt them into real-time control strategies, the long analysis times are still a bottleneck for real time monitoring and real time process control [1].
Spectroscopic techniques are great PAT solutions to accomplish these goals, and Raman is one of the most powerful spectroscopic techniques that has a great potential for future applications.
Analytical Application of Raman Spectroscopy in Downstream Processing
Raman spectroscopy is already employed in downstream processing applications listed below [1]:
- Measurement of product concentration and product aggregation: The product concentration estimation and monitoring of monoclonal antibodies (mAb) is critical in continuous perfusion processes. This part can be accomplished by UV spectroscopy without the need for advanced predictive mathematical modeling that Raman spectroscopy requires.
However, Raman spectroscopy achieves one goal that UV spectroscopy cannot achieve. Raman spectroscopy with quantitative modeling can be used for aggregate analysis. High concentrations of aggregate mAb types in the samples can be differentiated from each other due to having different Raman spectra. - Glycosylation: Distinguishing glycosylated and non-glycosylated proteins.
- Membrane fouling: The fouling of immersion probes within cross-flow filtration units can be monitored as well. Even though this could be challenging due to complex background and weak signals of proteins, there are promising signs.
Download Tornado Spectral Systems Application Note: High-Throughput Raman Analysis of Protein Glycosylation
Downstream processing summary
The downstream processing applications of Raman spectroscopy are still a very active research field and more will be evaluated and employed within the near future, as Raman spectroscopy will be an established analytical method within downstream processing field.
Raman Analyzer Process Instruments
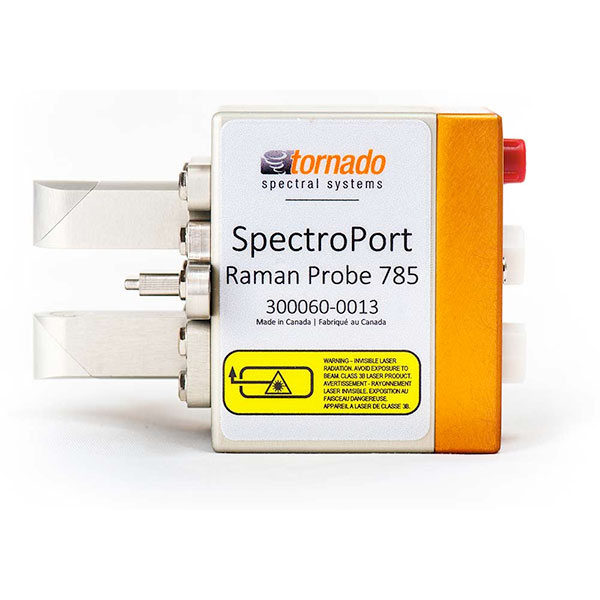
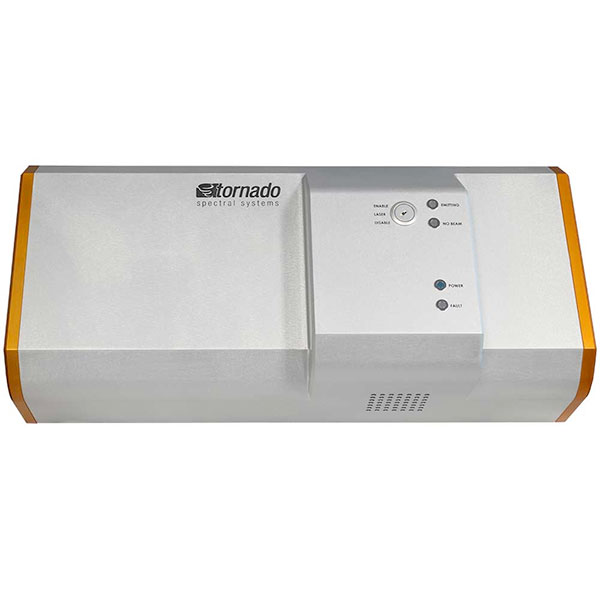
Available through PROAnalytics: Tornado Spectral Systems SpectroPort Raman Probe and HyperFlux PRO Plus Raman Analyzer
References
- Goldrick, S.; Umprecht, A.; Tang, A.; Zakrzewski, R.; Cheeks, M.; Turner, R.; Charles, A.; Les, K.; Hulley, M.; Spencer, C.; Farid, S.S. High-Throughput Raman Spectroscopy Combined with Innovate Data Analysis Workflow to Enhance Biopharmaceutical Process Development. Processes 2020, 8, 1179. doi: 10.3390/pr8091179
- Esmonde-White, K.A., Cuellar, M., Uerpmann, C. et al. Raman spectroscopy as a process analytical technology for pharmaceutical manufacturing and bioprocessing. Anal Bioanal Chem 409, 637–649 (2017). doi: 10.1007/s00216-016-9824-1
- Buckley K, Ryder AG. Applications of Raman Spectroscopy in Biopharmaceutical Manufacturing: A Short Review. Applied Spectroscopy. 2017;71(6):1085-1116. doi:10.1177/0003702817703270
- Sibley, M. et al. “Novel Integrated Raman Spectroscopy Technology for Minibioreactors Accelerating Raman Model Building for Cell Culture Monitoring and Control.” (2020).
- Abu-Absi, Nicholas & Martel, Richard & Lanza, Amanda & Clements, Stacey & Borys, Michael & Li, Zheng Jian. (2014). Application of spectroscopic methods for monitoring of bioprocesses and the implications for the manufacture of biologics. Pharmaceutical Bioprocessing. 2. 267-284. 10.4155/pbp.14.24.
- https://www.photonics.com/Articles/Spectroscopy_Mastering_the_Techniques/a25126
- Kögler, M. (2018). Advanced Raman Spectroscopy for Bioprocess Monitoring: Dissertation. doi: 10.14279/depositonce-6684
- Ryabchykov, Oleg, Guo, Shuxia and Bocklitz, Thomas. “Analyzing Raman spectroscopic data” Physical Sciences Reviews, vol. 4, no. 2, 2019, pp. 20170043. doi: 10.1515/psr-2017-0043
- https://metrohm.blog/on-in-at-offline/
- Yilmaz, D, Mehdizadeh, H, Navarro, D, Shehzad, A, O’Connor, M, McCormick, P. Application of Raman spectroscopy in monoclonal antibody producing continuous systems for downstream process intensification. Biotechnol Progress. 2020; 36:e2947. doi: 10.1002/btpr.2947
- Banner image illustration source: Silvère André, Lydia Saint Cristau, Sabine Gaillard, Olivier Devos, Éric Calvosa, Ludovic Duponchel, In-line and real-time prediction of recombinant antibody titer by in situ Raman spectroscopy, Analytica Chimica Acta, Volume 892, 2015, Pages 148-152, ISSN 0003-2670, https://doi.org/10.1016/j.aca.2015.08.050.