If you are a Tax Exempt customer, please upload your tax-exempt certificate here. Your tax-exempt status must be reviewed and approved before placing an order in order for the order to be tax-exempt. If you submit your exemption request but place an order before approval, sales tax will be charged, and refunds cannot be guaranteed. Approval confirmation will be sent via email. If you are not tax-exempt and self-assess and pay sales tax to your state directly, please contact orders@pro-analytics.net to prevent sales tax duplication.
Ultraviolet and visible light range (UV/VIS) is widely applied in research, production and quality control for the classification and study of substances. UV/VIS spectroscopy is based on the absorption of light by a sample. Depending on the amount of light and its wavelength absorbed by the sample, valuable information can be obtained, such as the purity of the sample. Moreover, the amount of absorbed light is related to the amount of sample, and thus, quantitative analysis is possible by optical spectroscopy. This article more specifically explores techniques when using a spectrophotometer to determine concentration of an analyte.
A UV/VIS spectrophotometer measures the intensity of light passing through a sample solution in a cuvette, and compares it to the intensity of the light before it passes through the sample. The main components of a UV/VIS spectrophotometer are a light source, a sample holder, a dispersive device to separate the different wavelengths of the light and a suitable detector.
This instrument measures Transmittance which is the ratio of the transmitted intensity I to the original intensity of light. An important derived (calculated) variable also reported by the instrument is the Absorbance which is defined as A = −log(Transmittance).
Figure 1. Absorbance as a function of wavelength.
In general, a UV/VIS spectrum is graphically represented as absorbance as a function of wavelength. The advantage of this representation is obvious; the height of the absorption peaks is directly proportional to the concentration of the species.
The calculation of concentration is governed by the Lambert-Beer Law. To calculate the concentration:
C = A / ε (epsilon) x d
Where
C =The sample concentration in mol / L or g / mL,D = Cuvette path length in cmΕ = (epsilon) sample specific constant (describing how much the sample absorbs at a given wavelength)
In addition to the Quantitative Analysis, measuring the full UV/Vis absorption spectra allows substance identification. More precisely, the position and, to some extent, the profile of the absorption peaks allow specific compounds to be identified.
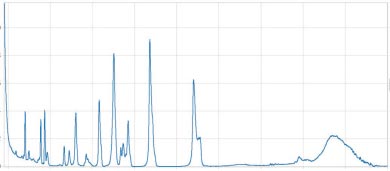
Figure 2. Example of Chlorophyll UV/Vis spectra
Each sample has a characteristic and unique UV/VIS spectrum that can be used for its identification. In particular, this is achieved by comparing the spectrum of the sample with spectra of known, pure compounds. As an example of UV/VIS spectrum, the spectrum of chlorophyll a is shown above.
Quantitative Analysis
There are three main application areas for quantitative analysis:
Using spectrophotometer to determine concentration
Metal ions e.g. iron, copper, nickel in Pharma
Inorganic ions, e.g. nitrate in water treatment
Chemical Oxygen Demand (COD) in F&B and Electroplating
Analyte concentration vs. time
Enzyme kinetics: determination of rate of catalysis in Pharma
Glucose oxidase catalyzes the oxidation of β-D-Glucose by oxygen (725 and 415 nm)
Oxidation and reduction of pyridine nucleotides
(NAD+/NADH, 340 nm).
Cholesterol oxidation rate by catalysis with Cholesterol Oxidase (500 nm)
GPO colorimetric kinetic test for tryglycerides (520 nm)
Physico-Chemical Paramaters
Acid dissociation constant
Complex formation constan
Partition distribution coefficient
Dissolution test
Calibration
When using a spectrophotometer to determine concentration of a sample solution of unknown concentration by UV/VIS spectroscopy, a calibration line must first be created. This is done by measuring the light absorption of several standard solutions of different, known concentrations at a predefined, fixed wavelength. The below calibration line is obtained:
Figure 3. Absorbance vs. concentration (mg/L)
Once the calibration line is established, the unknown concentration of a sample con be determine by plotting in the above graph.
Spectrophotometer Designs:
The following two configurations are generally used in UV/VIS spectroscopy:
Scanning spectrophotometer
Array spectrophotometer
Scanning Spectrophotometers measure of transmittance at multiple single wavelengths. The light is first dispersed into individual wavelengths using a reflection grating. The grating is rotated in order to individually select each wavelength that is then sent through a cuvette. The transmittance at this specific wavelength is recorded. The whole spectrum is obtained by continuously changing the wavelength of light (i.e. scanning) incoming onto the sample solution by rotating the grating.
Alternately, in Array Spectrophotometers, the sample is illuminated by a light beam consisting of all spectral components of the UV/ VIS range. The sample in the cuvette absorbs all wavelengths simultaneously and the transmitted light is diffracted and then detected by a CCD sensor.
Measuring the whole UV/VIS spectrum is generally faster than using a conventional scanning spectrophotometer since the spectrum is recorded simultaneously at all wavelengths. Moreover, an array detector has an integrating function which accumulates individual measurements to enhance the signal, leading to a strongly increased signal to noise ratio, and thus to an improved signal quality of the measured spectrum. Array Spectrophotometers present an innovative approach to speed up full spectrum scan based on reverse optics technology. The robust design without any moving optical parts ensures very good optical performance.
Cuvette Based UV/VIS Spectroscopy
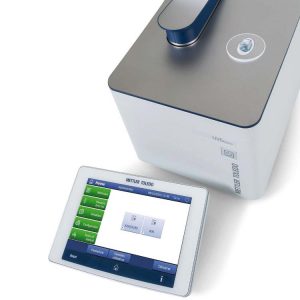
An innovative single beam array spectrophotometer for the UV/VIS range has been developed by Mettler Toledo. The light source consists of a Xenon flash lamp for the ultraviolet (UV) as well as for the visible (VIS) and near-infrared wavelength regions covering a spectral range from 190 up to 1100 nm. The lamp flashes are focused on a glass fiber which drives the beam of light onto a cuvette containing the sample solution.
A diffraction spectrograph and subsequent CCD Sensor record the full spectra with fast response and high resolution.
This instrument is capable of measuring very small volumes and highly concentrated samples. The sample is pipetted directly onto the measuring platform, without further dilution.
Therefore, manipulation errors are avoided. Moreover, the selection of a specific path length allows for the measurement over a large concentration range with as little as 1 µL of sample.
For more information, please refer to Mettler Toledo’s Complete UV/VIS Spectrophotometry Guide.
Available through PROAnalytics: UV Vis Spectrophotometer
References
ResearchGate – UV/VIS Spectrophotometry – Fundamentals and Applications
Marcelo Luftman is the managing director of PROAnalytics LLC, a company dedicated to providing PAT Bioprocessing Solutions. PROAnalytics main areas of expertise include bioreactor probes (biomass, pH, DO, OD, etc.), photometric biochemistry cell culture analyzers, process information management software (PIMS), cell imaging systems, off gas sensors, non-invasive flow sensors, process chillers, and lab analyzers & lab automation systems. PROAnalytics solutions comprise from single analyzers up to complete integrated systems.


 A diffraction spectrograph and subsequent CCD Sensor record the full spectra with fast response and high resolution.
This instrument is capable of measuring very small volumes and highly concentrated samples. The sample is pipetted directly onto the measuring platform, without further dilution.
Therefore, manipulation errors are avoided. Moreover, the selection of a specific path length allows for the measurement over a large concentration range with as little as 1 µL of sample.
For more information, please refer to Mettler Toledo’s Complete UV/VIS Spectrophotometry Guide.
Available through PROAnalytics: UV Vis Spectrophotometer
A diffraction spectrograph and subsequent CCD Sensor record the full spectra with fast response and high resolution.
This instrument is capable of measuring very small volumes and highly concentrated samples. The sample is pipetted directly onto the measuring platform, without further dilution.
Therefore, manipulation errors are avoided. Moreover, the selection of a specific path length allows for the measurement over a large concentration range with as little as 1 µL of sample.
For more information, please refer to Mettler Toledo’s Complete UV/VIS Spectrophotometry Guide.
Available through PROAnalytics: UV Vis Spectrophotometer