Reports
Achieving Superior Raman Measurements: Understanding and Avoiding Detector Saturation

Aug
One of the primary technological advantages of Tornado Raman analyzers over conventional Raman devices is the significantly higher optical efficiency delivered by our HTVS™ platform (described in this prior blog post). With 10x to 30x more photons per second, Tornado systems provide superior spectral data for better precision and sensitivity for PAT measurements, as we have discussed previously. However, this veritable flood of photons can sometimes overload or saturate the light detector within the Tornado spectrometer (a “charge-coupled device”, or CCD), preventing reliable intensity measurements of some regions of the spectral range. In extreme cases, the photon-generated electrons can spill over into adjacent regions on the CCD’s photosensitive surface in a phenomenon known as blooming. Fortunately, it is straightforward to avoid saturation and blooming…if you know what to watch out for. This blog post provides an introduction to these concepts and offers guidance for Raman users who want to get the best measurement quality out of their spectroscopic data.
Saturation and blooming are phenomena that occur in all digital camera sensors, both CCDs and CMOS sensors, affecting both their quantitative and qualitative imaging characteristics. If each individual pixel can be thought of as a bucket or “well” which can accumulate electrons, then saturation refers to the condition where the well becomes completely filled. For many years, CCD image sensors and cameras have offered advantages in data quality such as greater dynamic range, better noise performance, and better uniformity, but CMOS sensor technology has become more prevalent for most imaging applications. However, CCD cameras are still better for the most demanding Raman application – those needing the highest accuracy and precision, where sensitivity in low light is critical – so we will focus on saturation and blooming for those types of sensor devices.
Tornado optical spectrometers make use of a CCD to convert photons (light particles) into electrons, which are digitized by a special converter circuit within the camera electronics. In essence, the number of electrons accumulating within each pixel of the CCD is converted into a 16-bit number (values from 0 to 65,535) linearly proportional to the Raman spectral intensity at one point in the spectral range. Thousands of intensity values are measured within a few milliseconds, transmitted to the control computer, and then graphed as an optical spectrum along the wavenumber range of the instrument. Similar sensors are used in cell phone cameras, higher-end digital photography equipment, and digital telescopes to create images instead of spectra, but the concept is the same – quantifying light intensity at different locations on the sensor surface.
In order to get the best spectrum or image possible, it is necessary to obtain the most signal by maximizing the photons hitting the CCD. This goal can be accomplished by increasing the exposure time and collecting more photons per pixel. However, if the number of photons exceeds the capacity of that pixel’s well, then the measured electronic response becomes nonlinear, and the spectrum or image becomes saturated at that location. Essentially, each pixel has a saturation charge level, that when reached, overflows the excess photo-generated charge into the nearest adjacent wells in the image area. This effect is commonly referred to as “blooming” or “oversaturating”, and the architecture of the CCD detector makes it such that this blooming is expected to occur primarily in the same column as the saturated pixel (vertically).
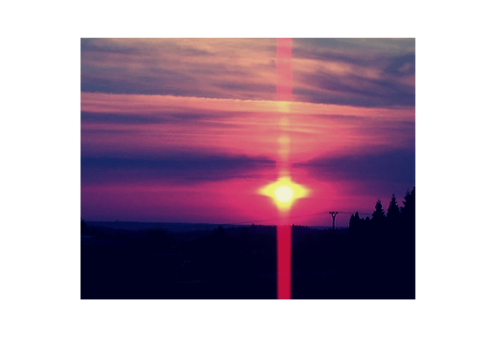
A similar phenomenon can be seen when trying to take a picture of the sun without the right filter — Figure 1 illustrates blooming on the sun itself. As a result, the photons in the image area of the sun overflow the wells in that area and are transferred vertically through the CCD wells causing the bright line seen in the image.
The same phenomenon occurs when oversaturating a CCD detector in an optical spectrometer. When the exposure is too high for the saturation charge level of the detector, that area of the spectrum becomes saturated, and blooming can be seen in the spectral image.
Figure 2 shows us spectra of a simple analyte, caffeine, at three different levels of saturation. The levels of saturation are: 95% saturation, two times the saturation level, and four times the saturation. The low wavenumber region of the spectrum looks markedly different in each of these levels.
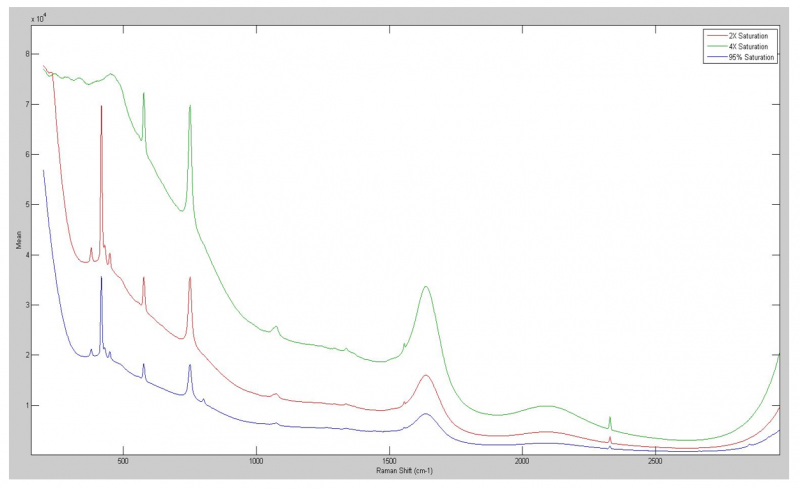
If we look at only the low-wavenumber portion of the spectra (Figure 3), the differences become more pronounced. The 95% of saturation spectrum (blue) shows no evidence of saturation or blooming, as expected. The 2X saturation spectrum (red) shows saturation up to around 250 cm-1 and possible evidence of blooming after saturation. The 4X saturation spectrum shows evidence of saturation up to 450 cm-1 and evidence of blooming from 450-525 cm-1. It is important to note the sapphire peak located at approximately 420 cm-1. The most prominent peak shown is at the 95% saturation level. At the 2X saturation level, it is still the most prominent peak. However, at the 4X saturation level, this peak is missing due to oversaturation of the CCD. Indeed, all of the peaks from 0-550 cm-1 have “disappeared” due to saturation and blooming.

One question frequently asked by Tornado’s customers is, “Can I saturate part of my detector to increase my signal if my peaks of interest are in a different, unsaturated part of the spectral range?” Let’s take a closer look at that. Figure 4 shows a peak of interest, the 1050-1080 cm-1 region of the caffeine spectrum, under the three different levels of saturation. The increasing saturation level of the detector increases the signal of that area of interest. Thus, this provides more information about the analyte. However, other effects can also be seen in the spectra such as the following.
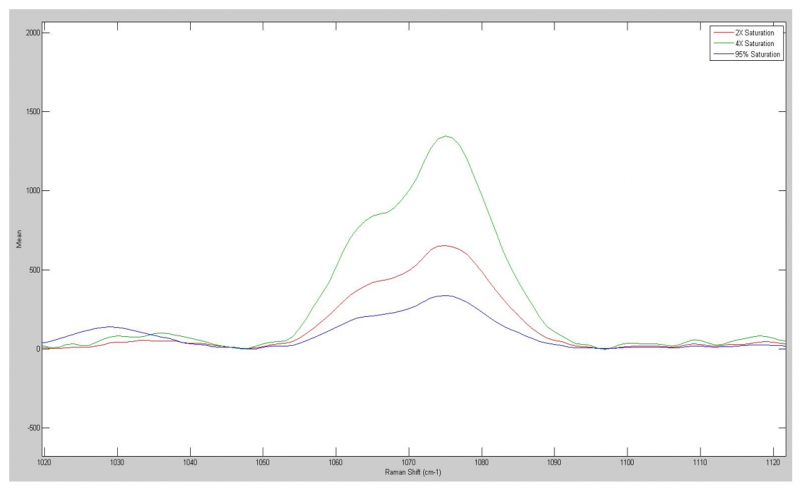
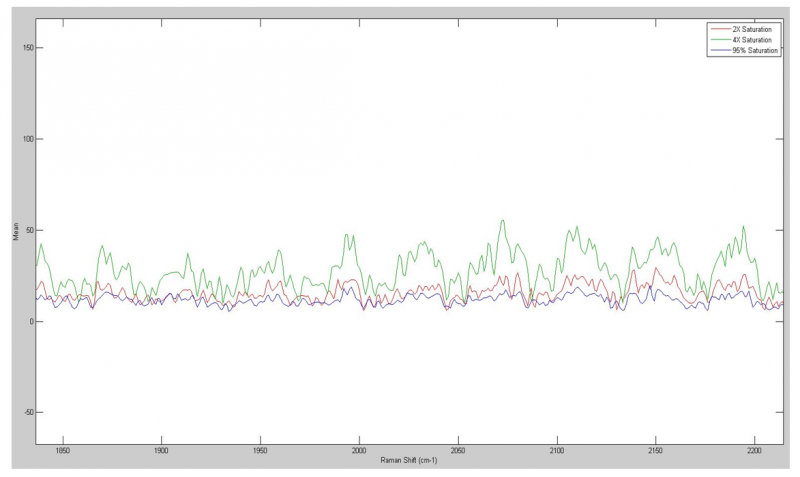
Figure 5 shows an area of the same spectra which should include no analyte information. However, with increasing levels of saturation, an increase in peaks in this area is evident. By increasing exposure time, the peaks in all areas of the spectra that are not saturated, are increased. This includes noise and any cosmic radiation hits. The conclusion from this demonstration is increasing your detector past its saturation limit can increase the peaks of interest, but also increases the level of noise and artifacts in your spectra.
The other potential problem with routinely oversaturating your CCD is the possible damage to its photosensitive surface. Nearly all manufacturers of CCDs warn against long-term saturation of the camera. In the long run, the results of this could be a failing detector, or ghost images (much like the afterimage in your eye after looking at a bright light). There are procedures to permit a CCD to recover from this sort of treatment, but it’s better to avoid excessive saturation in the first place.
If you need better measurements (higher signal-to-noise ratio, smaller limit of detection, etc.) of weak peaks or bands in your Raman spectrum, we recommend increasing the number of averages instead of increasing the exposure time. Although the Raman peaks will not appear any stronger, the noise levels will be decreased by the larger number of averages, so that even weak peaks can deliver excellent quantitative results from the chemometric analysis.
Conclusion
Turbocharged by Tornado’s patented High Throughput Virtual Slit (HTVS™) technology, our Raman analyzers give you 10X improvement in photon throughput and signal strength versus a conventional spectrometer. This means an overall increase in signal-to-noise ratio that gives the customer the best possible spectrum without saturating the detector. This increase in signal without saturation and blooming means measurements that you can trust without the effect of increasing the spectral noise level or damaging your detector in the long run.
If you would like to discuss your application and are considering adopting Raman spectroscopy as a process analytic technology, please contact us at info@tornado-spectral.com
Source: Tornado Spectral Systems