Reports
OD600 Measurement Results Using Spectrophotometers & Online OD Instruments
Spectrophotometers can be an excellent tools to monitor the growth phase or determine cell concentrations in microbial fermentation processes. Despite of the fact that these instruments are generally utilized to measure absorbance of particular samples (concentration measurements), spectrophotometers are also used to quantify light scattering running at 600 nm wavelength. This method, commonly known as OD600 measurement, is known to provide consistent cell growth results when well-accepted practices are applied.
In addition, new online OD probes can be utilized to monitor a process continuously, using the OD600 spectrophotometer data to validate the online results and calibrate the online measurements in concentration units (i.e. grams / liter).
An OD600 measurement is dependent on the type of instrument configuration being used, and also differs on its results comparing among different microbial processes (organisms). For example, larger organisms tend to scatter more light than smaller ones (yeast vs bacteria), and minor differences in cuvettes’ paths produce different measurement results. The utilization of the proper measurement technique allows the user to produce results that are comparable among different instrument configurations and that can be trusted as a repeatable method to qualify a particular process.
OD600 Measurement Principle
As visible (600 nm) light passes through the sample, it is scattered in a 360 degree radius with a Radom distribution of intensities depending on cell shape and size and on the concentration of cells in the sample. A measurement of the light intensity reflected by the sample will then correlate to the cell concentration. The path length and wave length on the particular instrument setup must be well-defined and controlled to secure reproducible results. Additionally, since researchers rely on OD600 values published for particular processes to establish the right time for harvesting or inoculation, it is essential to pay attention to the correct instrument parameters.
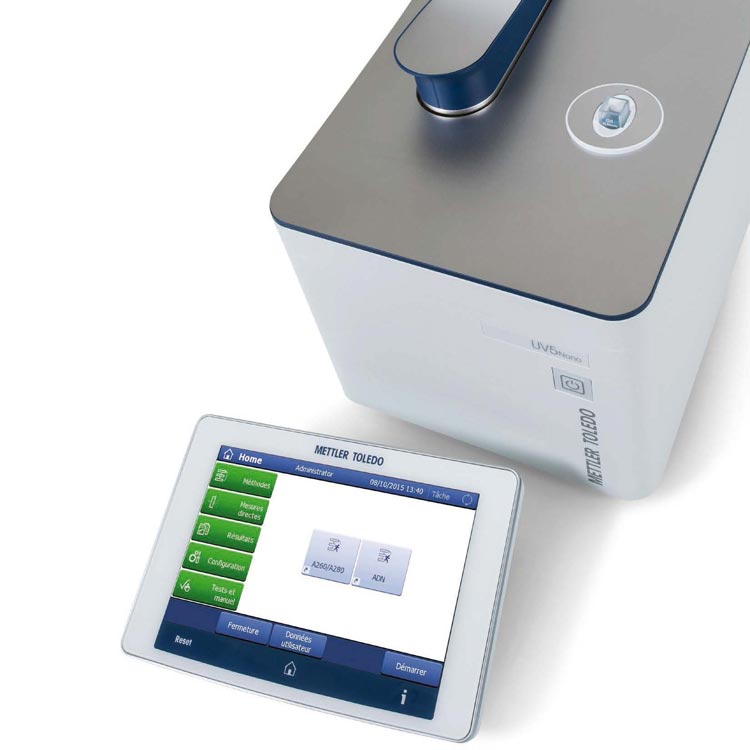
Available through PROAnalytics: UV VIS Spectrophotometer
Empirical Values
Scientists are often relying on published OD600 data to take different actions during the course of a fermentation. For optimal results, the OD600 measurements need to be consistent and repeatable.
Since all the variables related with the instruments being used and the processes being characterized are rarely known, it is recommended that empirical concentration measurements be determined by the use of growth curves correlating OD600 values against plate counts for any particular cell type.
New UV/VIS spectrophotometers provide the ability of measuring micro samples extending the measurement range to high concentration values. This is true thanks to the automatic path length adjustment feature. It is, however, recommended to establish a conversion factor comparing results among spectrophotometers, especially in cases where historical data has been generated with cuvette-type instruments.
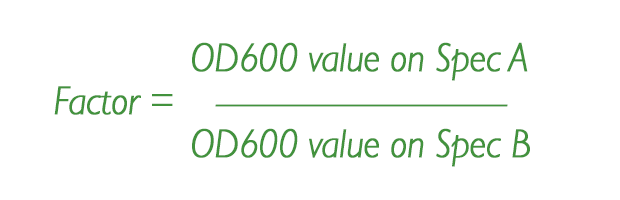
The best approach for determining the conversion factor involves utilizing samples in both spectrophotometers that are closed to a desired “target” OD600 number specially relevant to the process of interest. In those cases where the cuvette-style instrument cannot reach a high concentration measurement, apply the correct dilution technique. Once both measurements have been obtained, the conversion factor is calculated as the ratio between both measurements:
Comparative Study
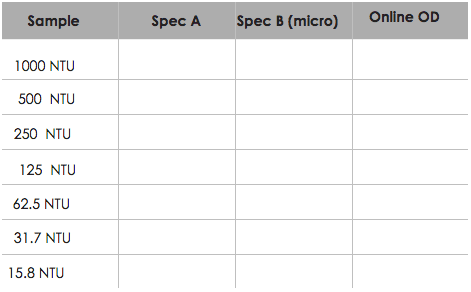
A widely accepted Turbidity Standard (1000 NTU) can be used to compare results among two types of spectrophotometers. As mentioned earlier, dissimilar optical arrangements among two instruments would provide different OD results when measuring the same sample for scattered light. To test and recognize the differences, and ultimately establish a conversion factor, the 1000 NTU standard Formazin solution can be subsequently diluted by a factor of 2, registering each measurement (for each dilution) on both instruments.
After performing 7 dilutions and obtaining a total of 7 measurements on each instrument, the conversion factor can be calculated as the ratio between the average reading on Spec A to the average reading on Spec B. Furthermore, the obtained results can be utilized to developed the linear relationships between OD600 and NTU for each spectrophotometer.
Additionally, if the ultimate objective is to establish a correlation between an OD600 spectrophotometer measurement and an Online Optical Density Probe, each sample measurement on the OD probe can be recorded as well to also establish that comparison.
Table 1: to be filled in with experimental results
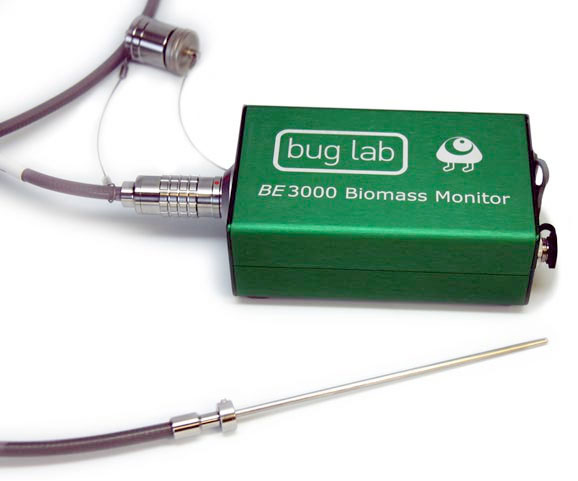
Available through PROAnalytics: OD Measurement Instruments
Linear Range Measurements
Spectrophotometers using cuvettes are limited in the upper concentration range. Generally the highest measurable OD600 value to achieve with these types of instruments maintaining linearity is not very high.
To compare readings against micro-sample spectrophotometers (which reach much higher concentration values), it is necessary to dilute the samples to be measured in the cuvette-type instrument. At the same time, if correlating with live cell concentration measurements (like those from plate counts ), running samples from different stages of the growth curve on the cuvette spectrophotometer will show the maximum concentration value that can be measured before losing linearity in the measurement.
Once all data has been collected for each particular sample concentration, the two different linear relationships (for Spec A and Spec B) can be plotted. Slopes will generally differ. Experimentally, applying good sampling and analytical techniques, the variation between the two slopes is in the order of 15- 25%. At the same time, the Online OD probe results can be plotted to observe how well the discrete spectrophotometer results fit this third linear relation. The spectrophotometer results can be used as well to create a calibration curve on the Online OD probe instrument.
Determination of Concentration Values
As mentioned earlier, different cell types create distinct light scattering profiles resulting in different correlation factors between OD600 values and viable cell concentration values. For that reason, it is essential to establish a dedicated correlation factor for each particular process/cell type. Modern spectrophotometers and OD600 measurement instruments allow a user to enter the calibration results to display concentration values directly.
Generally accepted practices for OD600 spectrophotometer measurements:
- When taking a sample from your culture, make sure the process is well mixed and that no cell settling is taking place.
- Properly cleaned high quality cuvettes should be used to avoid errors associated to the analytical technique. Mettler Toledo recommends using Quartz Cuvettes only.
- Do not use glass pipettes. They can scratch the quartz cuvettes.
- Insert the cuvettes with the proper orientation in the instrument.
When using a micro sample spectrophotometer:
- Thoroughly clean both sample measurement surfaces before introducing the sample.
- Pipette 1 micro liter of sample making sure no air bubbles are introduced.
- Close the arm sealing the chamber tightly.
In summary, the above technical note is intended to provide a basic method for obtaining repeatable OD600 measurement results on particular fermentation processes and correlate those values with online OD probes measurements with the ultimate objective of establishing a reliable process calibration curve.