Reports
Perfusion Culture Optimization Through Accurate Metabolite Analysis Towards Integrating Continuous Perfusion Bioreactor with Continuous Countercurrent Tangential Chromatography (CCTC)
Jul
Soroosh Soltani1, Harleigh McNally1, Dmitriy Fedorenko1, Jasmine Tan1, Marcelo Luftman2, Justin Lussier2, Andrew Zydney3, Oleg Shinkazh1, *
1 Chromatan Corporation, 3 Spring House Innovation Park Suite 103, Lower Gwynedd, PA, 19002
2 PRO Analytics, LLC, Fairfield, NJ
3 Department of Chemical Engineering, The Pennsylvania State University, University Park, PA 16802
* Communication concerning this manuscript should be addressed to:
Oleg Shinkazh, ChromaTan Corporation, 3 Spring House Innovation Park, Suite 103, Lower Gwynedd, PA, 19002
E-mail: oleg.shinkazh@chromatan.com
Abstract
There is growing interest in the development of new platforms for the continuous production of high-value biologics such as monoclonal antibodies. The work described in this paper is a part of our efforts to commercialize an Integrated Continuous and Single-use bio-production platform (ICS, sponsored by Phase II SBIR Fast Track from NIH) for flexible and robust manufacturing of therapeutic proteins. This involves the integration of a single-use perfusion bioreactor and Continuous Countercurrent Tangential Chromatography (CCTC), a patented purification system developed by ChromaTan Corporation. In contrast to conventional fixed bed columns or multi-column processes, CCTC utilizes the resin in the form of a slurry which flows through a series of static mixers and hollow fiber membrane modules, providing high yield and purification for truly continuous, steady-state production of biotherapeutics.
The current work is focused on optimizing the perfusion process to achieve the highest cell density, and consequently, mAb productivity, by controlling key process variables and metabolite levels. ChromaTan has partnered with ProAnalytics who has provided a Randox RX series automated photometric analyzer, which has shown exceptional and reproducible results for multiple important bioreactor variables – glucose, glutamine, glutamate, lactate, LDH and ammonia. We jointly evaluated the biochemistry analyzer to monitor accuracy and reproducibility over long-term (>30 day) operation of the bioreactor. Results showed that the Randox RX series automated photometric analyzer had a robust and accurate performance during one month of operation. Moreover, we performed analysis on both cell containing and cell free samples with the results showing good agreement. Monitoring glucose and glutamine over the course of the experiment enabled us to provide sufficient amount of nutrients to achieve 60×106 viable cells/ml as part of a fully integrated continuous process.
Introduction to Continuous Countercurrent Tangential Chromatography (CCTC)
Many industries are adopting continuous processing to enhance the product quality and reduce the capital equipment costs and facility size. Continuous processing can increase the productivity with greater flexibility and higher reliability [1]. Perfusion bioreactors are now well-established for continuous upstream production of monoclonal antibodies (mAbs) and other recombinant products. Perfusion bioreactors can achieve high cell density and productivity by retaining cells in the bioreactor, but have not been used in a truly continuous integrated production process due to the lack of available technology for continuous product capture and purification [2].
Perfusion Bioreactor Instrument
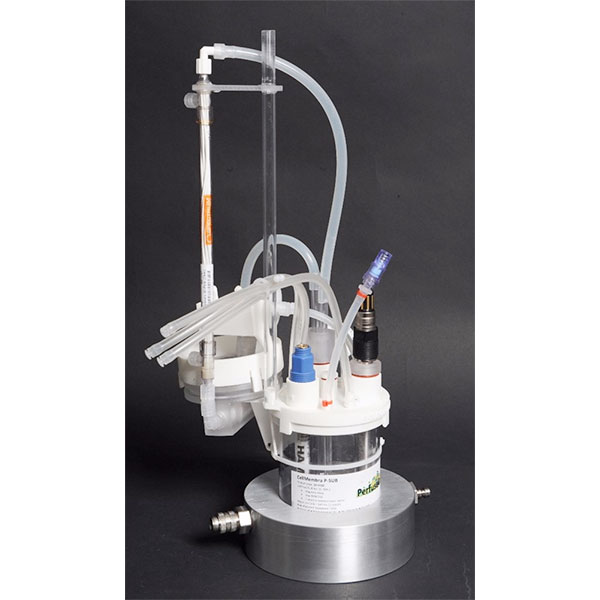
Available through PROAnalytics: PerfuseCell’s Perfusion Bioreactor Systems
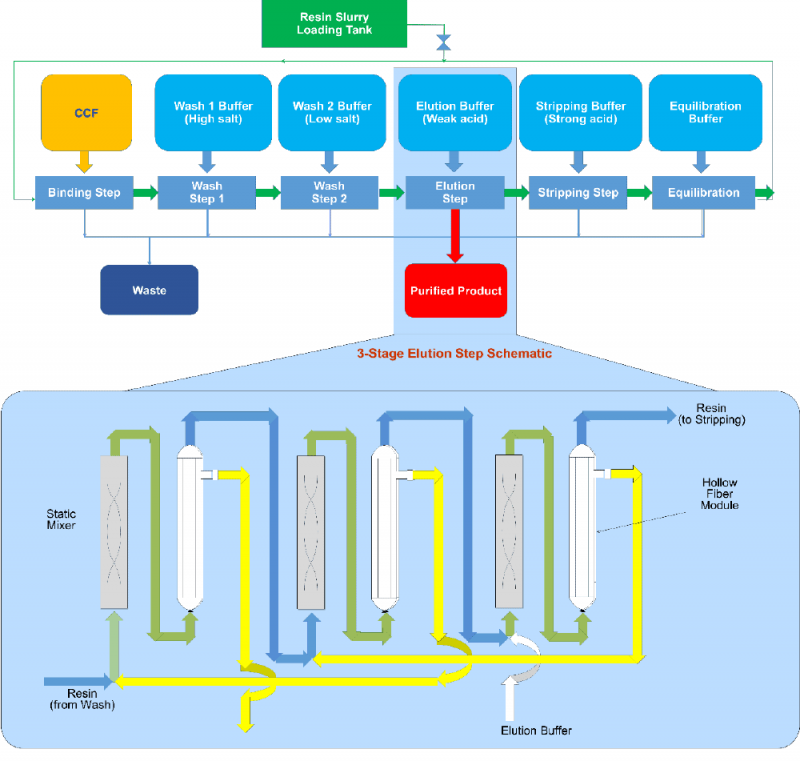
Continuous Countercurrent Tangential Chromatography (CCTC) [3–5], developed by Chromatan Corporation, has overcome many of the limitations of batch columns without the drawbacks of multi-column systems. The CCTC platform is a true moving bed technology that runs at steady-state and eliminates the use of columns. The novel design of the system enables short residence times, consistent product concentration and quality, and easier implementation of advanced Process Analytical Technology (PAT) and process control. In addition, CCTC is uniquely suited for processing sensitive molecules. The CCTC system has been shown to operate continuously with 5-10x greater productivity vs. batch columns, enabling a significant reduction of resin volume compared to batch column requirements [4].
All key chromatography steps: bind, wash, elution, strip and regeneration, are included in the patented Continuous Countercurrent Tangential Chromatography (CCTC) system (Figure 1). Static mixers and hollow fiber membrane modules are the building blocks of each step. The static mixers provide the appropriate residence time for target product / impurity binding (or desorption) during each chromatography steps. Hollow fiber membranes retain the resin and allow dissolved species to pass through and into the permeate stream. Different chromatography operations are performed simultaneously at steady state. The countercurrent configuration enhances the yield and impurity removal. Increasing the number of static mixers-hollow fiber membranes units increase the yield and reduce buffer consumption, with well-established procedures for optimization based on yield, purity and buffer consumption requirements. More details are provided in patented documents [6,7].
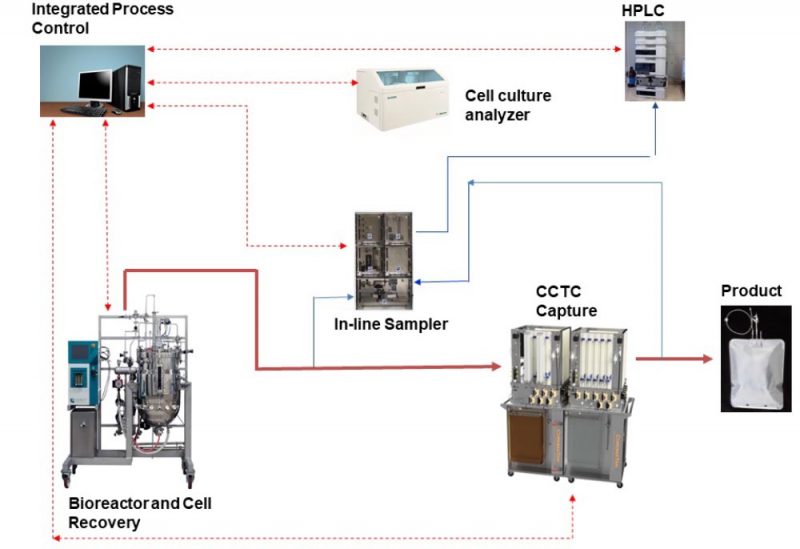
The National Institutes of Health (NIH) recently funded a $1.75 Million Fast-Track Phase II SBIR program to develop and commercialize a fully integrated continuous and single-use (ICS) bio-production platform. The ICS platform combines the advantages of perfusion bioreactors with Continuous Countercurrent Tangential Chromatography (CCTC) and delivers a compact and steady-state solution for manufacturing and purification of biologics (Figure 2). Modular design of CCTC creates flexibility in customizing and accessing the flow paths. This includes integration with automated sampling devices and analytical instrument such as in-line HPLC and off-line (or in-line) cell culture analyzer for advanced process operation. For example, in-line measurement of product titer by HPLC will be used to fine-tune the feed flow rate to the CCTC system to provide optimal resin loading in the CCTC system in response to any changes in perfusion reactor performance. The integrated control system will collect data from the bioreactor, the cell recovery system, CCTC capture, and analytical instruments (pH, conductivity, cell count, CCTC pressure profiles, titer, metabolites concentration, etc.). These data will be used to control key process variables such as perfusion rate, CCTC feed and buffer flow rates, sampling frequency, process duration, and startup / shutdown.
The overall goal of the ICS project is to achieve 50×106 viable cells/ml and to operate the system for 45 days at continuous steady state conditions. This work focused on developing the perfusion process and improving the feeding strategies to control nutrient levels to optimize cell density and viability by adjusting feeding strategies. This required a reliable biochemistry analyzer that would provide stable readings over >30 days of continuous operation. Membrane-based analyzers have multiple disadvantages such as time-consuming maintenance and measurement drift. The RX series biochemistry analyzer was chosen since it utilizes advanced technology based on automated photometric analysis to evaluate glucose, lactate, glutamate, glutamine, ammonia, and lactate dehydrogenase (LDH) levels. Verified control samples were used to investigate the instrument and assay performance, demonstrating that the Rx series biochemistry analyzer has robust performance in terms of accuracy, ease of use, and measurement stability.
Perfusion Bioreactor Case Study
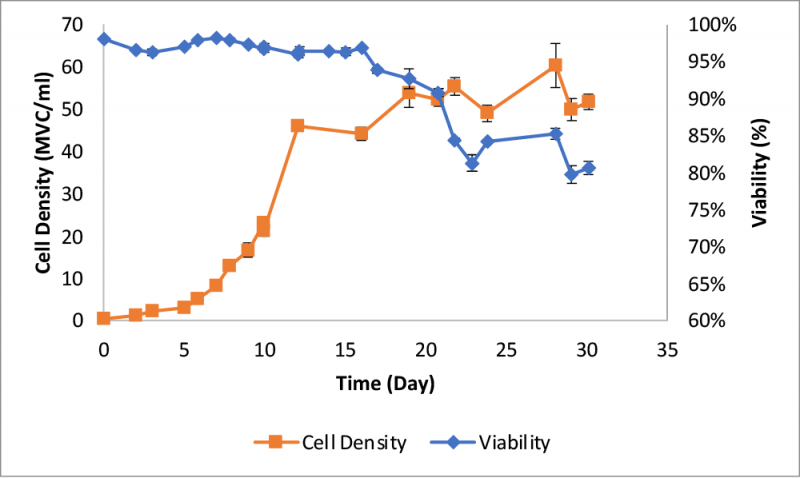
A 3-L autoclavable glass vessel with EZ-control unit and a Biosep acoustic cell retention device from Applikon Biotechnology was used for the perfusion process. Cell density exceeded 45 x 106 viable cells (MVC)/ml after twelve days (Figure 3) with a viability >95%. Daily bleeding was performed to maintain the cell density between 45 to 50 MVC/ml. Viability started to decline after day 16, and a significant increase in the decline rate was observed between days 20 and 22.
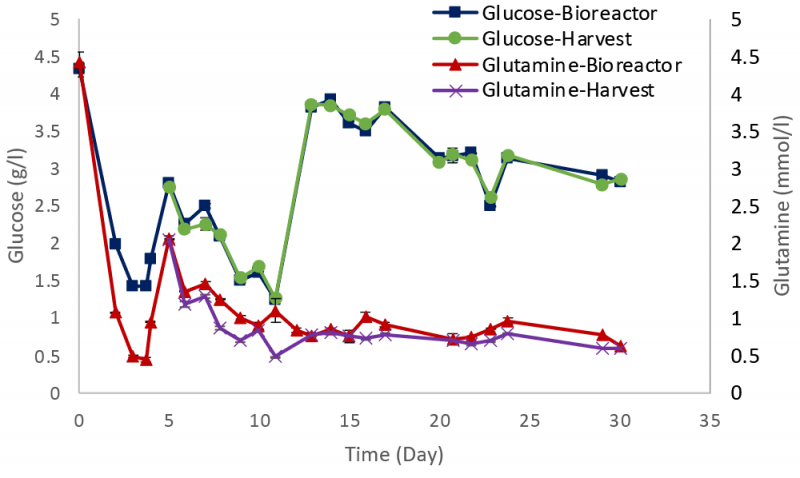
Metabolites such as glucose and glutamine were monitored during the experiment with values maintained close to the target concentrations (Figure 4), with similar profiles for both the bioreactor and harvest samples.
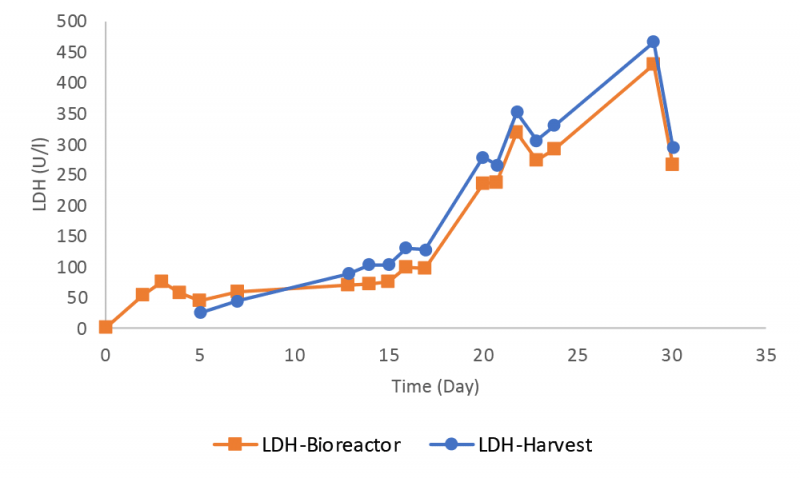
The LDH level increased during the bioreactor run (Figure 5), consistent with the decline in cell viability seen in Figure 3. Bioreactor samples had a lower LDH value than those in the harvest, possibly related to the preferential retention / recycle of intact cells by the Biosep acoustic cell retention device.
Randox Automated Photometric Analyzer Quality Control
Instrument performance was monitored frequently during the bioreactor run by using quality control samples for all six assays. The data for lactate dehydrogenase (LDH) and glutamine assays are presented here with the other results available in the supplementary information. The RX instrument provided robust measurements for LDH with a small deviation lower than one SD from the target value until day 22 (Figure 6).
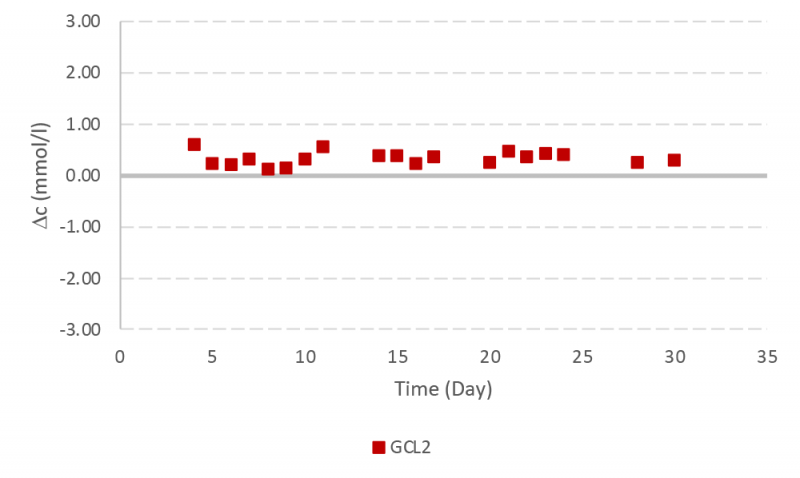
Glutamine controls samples were lower than two SD during the run. There were two incidents observed with measured values greater than two SD but lower than three SD (Figure 7).
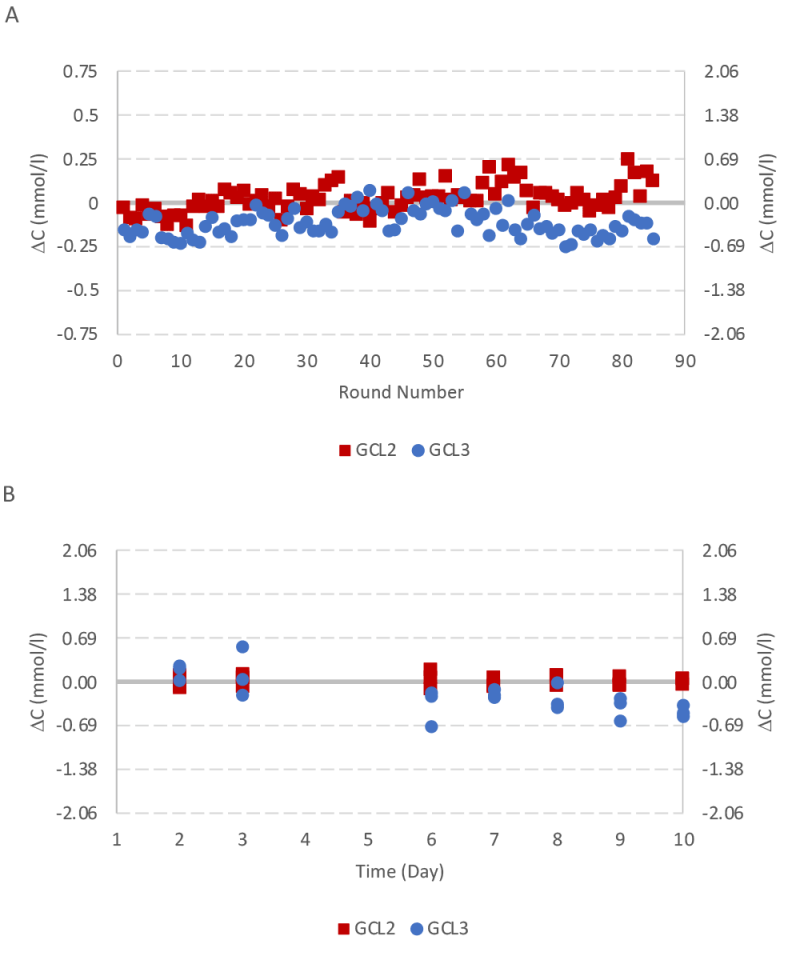
The instrument validation was repeated with another quality control experiment for a ten day period with glutamine control level 2 and 3. Results were less than one SD for both glutamine control samples (Figure 8).
Automated Photometric Analyzer Instrument
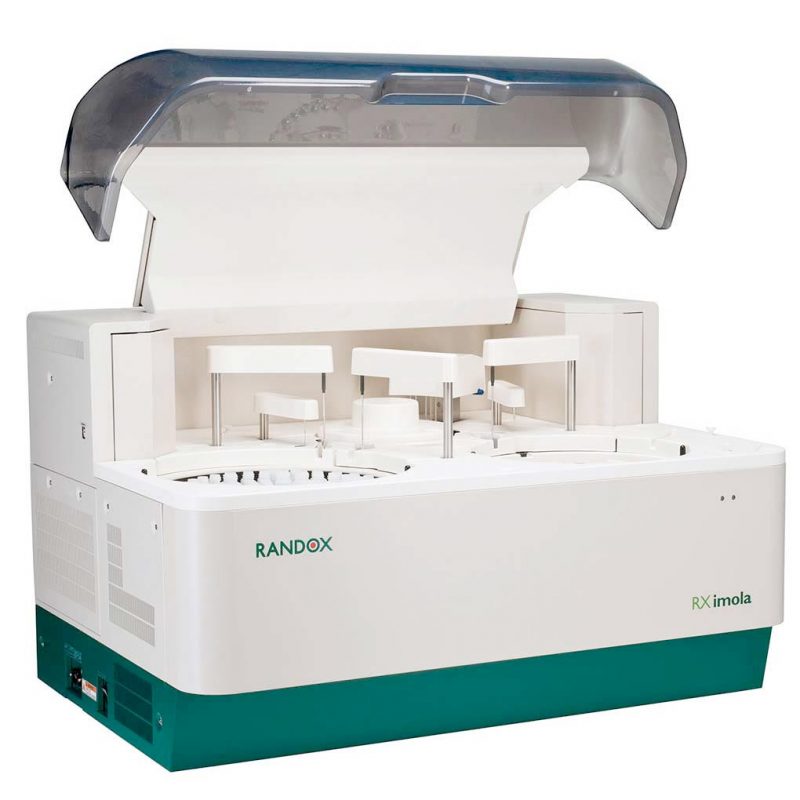
Available through PROAnalytics: Randox RX Series Imola Automated Photometric Analyzer
Continuous Countercurrent Tangential Chromatography (CCTC) Performance
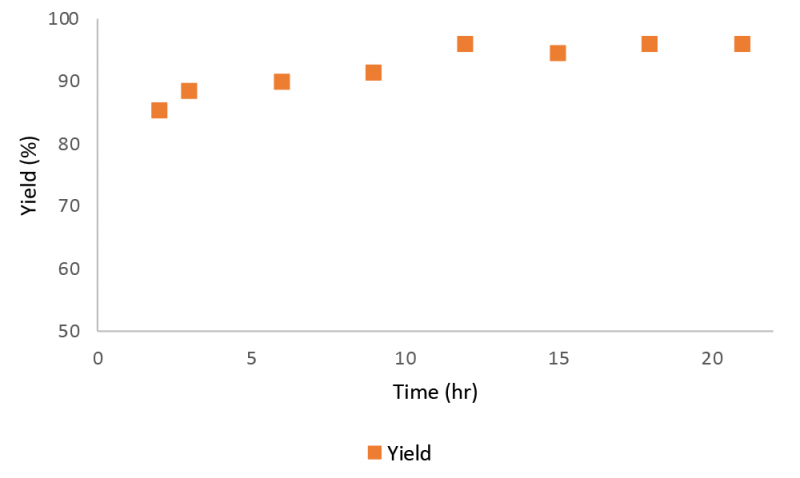
Figure 9 presents the mAb concentration profile in the product stream collected from the elution stage during a 21 hour Continuous Countercurrent Tangential Chromatography (CCTC) run. Associated yield is calculated and presented in figure 9 as well. The average yield was 92%.
Discussion
The target cell density was achieved and maintained for more than two weeks. Maintaining glucose and glutamine concentrations above the target values provided high cell density (60 x 106 viable cells / ml) and viability. The decline in viability towards the end of the process can be explained by high oxygen demand at higher cell densities beyond 45×106 cells/ml. A Bioreactor Oxygen PID controller was used to maintain the dissolved oxygen above the set point (30%); however, the very high oxygen flowrates introduced higher shear stress on the culture. The increasing trend in the LDH profile supported this hypothesis as a sharp rise in LDH profile was observed when the cell density exceeded 45×106 cells/ml. Improving mass transfer and manipulating PID parameters would allow one to deliver oxygen more efficiently at lower shear stress, allowing the culture to be maintained for a longer time at higher viability.
The Randox automated photometric analyzer provided accurate measurements of metabolite concentrations throughout the bioreactor run. The presence of cells (up to 60×106 cells/ml) did not interfere with the assays (except for the LDH assay), significantly reducing the required sample preparation. The instrument could load up to 72 samples at a time which made it ideal for high throughput analysis. An automated dilution system minimized the sample preparation time further and enabled the operator to load samples directly. Certified control samples verified the instrument performance in terms of stability and precision throughout the long term experiment. We have learnt that Randox has introduced a newer higher throughput model called Rx Imola, which is successfully being used at several other large bioprocess laboratories.
References
[1] M. Teżyk, B. Milanowski, A. Ernst, J. Lulek, Recent progress in continuous and semi-continuous processing of solid oral dosage forms: a review, Drug Dev. Ind. Pharm. 42 (2016) 1195–1214. doi:10.3109/03639045.2015.1122607.
[2] V. Warikoo, R. Godawat, K. Brower, S. Jain, D. Cummings, E. Simons, T. Johnson, J. Walther, M. Yu, B. Wright, J. McLarty, K.P. Karey, C. Hwang, W. Zhou, F. Riske, K. Konstantinov, Integrated continuous production of recombinant therapeutic proteins, Biotechnol. Bioeng. 109 (2012) 3018–3029. doi:10.1002/bit.24584.
[3] A.K. Dutta, D. Fedorenko, J. Tan, J.A. Costanzo, D.S. Kahn, A.L. Zydney, O. Shinkazh, Continuous countercurrent tangential chromatography for mixed mode post-capture operations in monoclonal antibody purification, J. Chromatogr. A. 1511 (2017) 37–44. doi:10.1016/j.chroma.2017.06.018.
[4] A.K. Dutta, T. Tran, B. Napadensky, A. Teella, G. Brookhart, P.A. Ropp, A.W. Zhang, A.D. Tustian, A.L. Zydney, O. Shinkazh, Purification of monoclonal antibodies from clarified cell culture fluid using Protein A capture continuous countercurrent tangential chromatography, J. Biotechnol. 213 (2015) 54–64. doi:10.1016/J.JBIOTEC.2015.02.026.
[5] O. Shinkazh, D. Kanani, M. Barth, M. Long, D. Hussain, A.L. Zydney, Countercurrent tangential chromatography for large‐scale protein purification, Biotechnol. Bioeng. 108 (2011) 582–591. doi:10.1002/BIT.22960.
[6] O. Shinkazh, High efficiency continuous countercurrent tangential chromatography, 2015. https://patents.google.com/patent/WO2015164511A1/en?inventor=oleg+shinkazh&oq=oleg+shinkazh (accessed October 18, 2018).
[7] O. Shinkazh, US20100193434A1 – Countercurrent tangential chromatography methods,systems, and apparatus – Google Patents, 2009.https://patents.google.com/patent/US20100193434A1/en?inventor=oleg+shinkazh&oq=oleg+shinkazh (accessed October 18, 2018).
[8] A.K. Dutta, D. Fedorenko, J. Tan, J.A. Costanzo, D.S. Kahn, A.L. Zydney, O. Shinkazh, Continuous countercurrent tangential chromatography for mixed mode post-capture operations in monoclonal antibody purification, J. Chromatogr. A. 1511 (2017) 37–44. doi:10.1016/J.CHROMA.2017.06.018.
Supplementary Information
Materials & Methods
Cell Cultivation
A mAb producer CHO cell line was cultivated in EX-CELL® ACF CHO Medium (Sigma-Aldrich, St. Louis, MO) with 4 mM glutamine (Sigma-Aldrich, St. Louis, MO). Trace elements A and B (Corning Inc., Corning, NY) were added to the media as well. The inoculum train was expanded from vial thaw. All expansions were performed in polycarbonate shake flasks at 37 ºC and 7.5% CO2. Cultivation was performed on a shaker with a ¾” throw set at 110 rpm. A 3-L autoclavable glass vessel with EZ-control unit from Applikon was used. A Biosep acoustic cell retention device from Applikon Biotechnology was used for the perfusion process. Cell free harvest was collected in a separate container (harvest container) by using a peristaltic pump.
Analysis
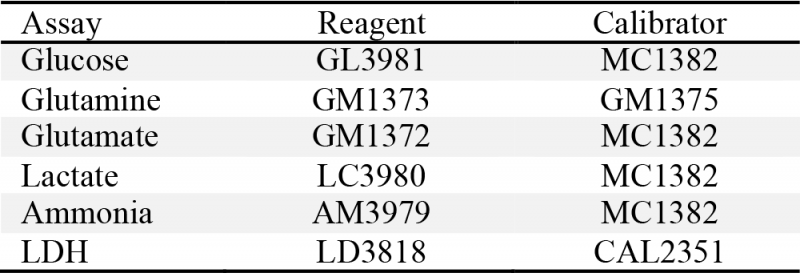
Cell density and viability measurements were performed by using trypan blue dye exclusion with a glass hemocytometer. Glucose, lactate, glutamine, glutamate, LDH and ammonium were analyzed with a RX Daytona analyzer (Randox Laboratories, Ltd., Crumlin, UK) provided by ProAnalytics LLC (Fairfield, NJ). Assay reagents and calibration solutions were purchased from Randox Laboratories (Table 1). Assay principle and calibration details are available through Randox Laboratories’ website.
Sampling Procedure
One sampling port was assembled on the dip tube (from the bioreactor) and another sampling port was assembled on the harvest stream. Cell density measurements were performed daily on both bioreactor samples and harvest samples to determine metabolite levels and to quantify the number of cells in the bioreactor and leaked through the Biosep cell retention device. Averages and standard deviations were calculated from two separate measurements. Bioreactor samples were transferred immediately into two sample cups for metabolite analysis (except LDH assay) without any additional sample preparation steps. Harvest samples were filtered through a 0.2 µm polyethersulfonate membrane (mdi Membrane Technologies, Ambala Cantt, India) to remove the cells. Turbidity generated from cells was observed to interfere with the LDH results, so LDH analysis was performed separately after centrifugation to remove cells.
QC Analysis
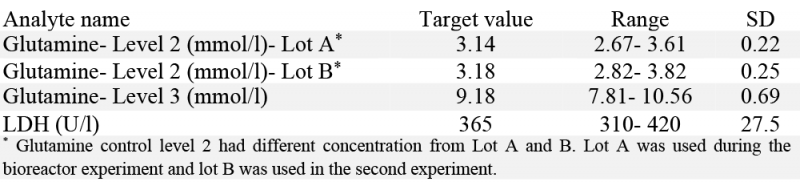
The performance of the instrument and assays were monitored by running quality control samples over the > 30-day operation. Human assayed multi-sera level 3 (HEI532) was used for LDH. Glutamine control level 2 (GM1377) and 3 (GM1378) were used for glutamine quality control analysis both during the bioreactor experiment (with glutamine control level 2 from lot A) and at the end of the bioreactor experiment. Table 2 presents the target values and concentration range for glutamine and LDH quality control samples. The standard deviation (SD) is approximately one fourth of the concentration range and presented in the last column.
Continuous Countercurrent Tangential Chromatography (CCTC) Operation
Clarified cell culture fluid containing 0.67 g/l of mAb was used to study the CCTC performance and to demonstrate the potential of the CCTC system for long term operations. The CCTC system consisted of binding, wash I, wash II, elution, strip, and equilibration steps [8]. Run duration was 21 hours under the steady state condition. mAb concentration was determined by using an HPLC method described in details in a previous study [8]. Samples were collected hourly to monitor the yield. Yield was evaluated from the ratio of mAb mass flow rate in the elution stream to mAb mass flowrate in the load stream.