Reports
Online Raman Spectroscopy: Benefits of Metabolites Monitoring & Impact on Upstream Productivity
Sep
Online Raman spectroscopy is a very well-established measurement technique for accurate measurements of glucose, lactate, viable cell density, and product concentration. Adaptive or closed-loop control strategies are now widely utilized to maintain glucose concentration at a fixed setpoint or to minimize lactate accumulation by adjusting the glucose feed rate. Additionally, this technology provides significant information about the process, leading to a better understanding of process dynamics and providing an efficient way to adjust the process during the run.
Correlation to Offline Measurement Techniques
Raman spectroscopy measurements have also shown very good correlation with traditional offline and atline metabolite analyzer techniques. In one study, glucose measurements from Mab-expressing cell line cultures by Raman spectrum demonstrated good correlation with reference data from Flex2 analyzer from Nova Biomedical, showing equivalent glucose and viable cell count profiles compared with the reference data. Other experimental data has shown good correlation with HPLC, UV/Visible spectroscopy analyzers and various chemistry analyzers confirming the quality of the information provided by online Raman spectroscopy.
Transferability of Raman Models between R&D, Process Development and Manufacturing
Thanks to its sharper bands, the Raman Spectrum provides detailed chemical information enabling the further ability of transferring models from small scale R&D settings to large scale manufacturing settings.
Why Raman Spectroscopy is So Powerful
Online Raman spectroscopy enables:
- The ability to monitor product quality continuously in real time
- The development of predictive and advanced feedback control strategies
- Upstream process optimization
Online Raman also facilitates the scalability of prediction models and methods from minibioreactors to large scale production bioreactors. This results in higher process efficiency and product concentration, superior and more consistent product quality, shorter cycle times, and lower costs due to a reduction of calibration tasks at different scales.
Online Raman Spectroscopy Key Advantages
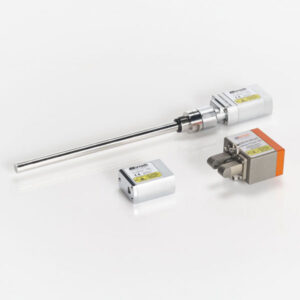
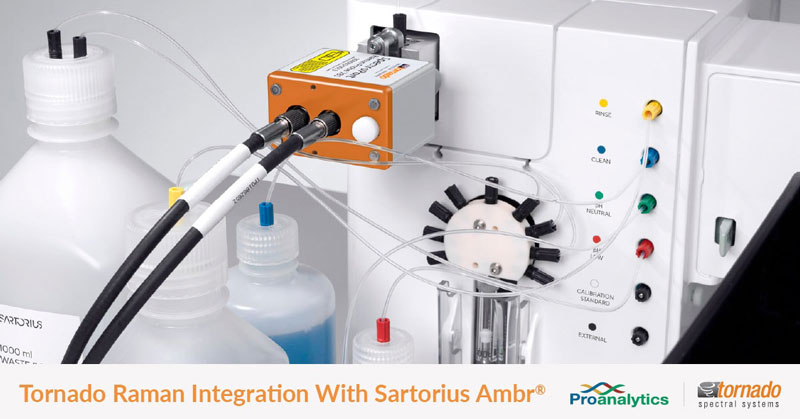
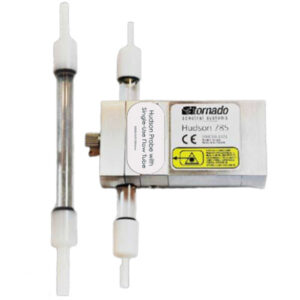
Great flexibility and ease of integration across various setups. Raman spectroscopy systems offer multiple options, including immersion probes for bioreactors, vessels and slipstreams, and large volumetric probes for use in manufacturing systems. Additional setups include single-use flow tubes, flow cells suited for perfusion experiments, and non-contact probes for detection without direct contact. The use of fiber optic cabling and multiplexing further enhances the versatility of installations, allowing for adaptable configurations to fit specific experimental or industrial needs.

Diminished interference from water enables measurements of analytes in aqueous environments: Online Raman spectroscopy has an inherent advantage when measuring analytes in aqueous environments/solutions due to diminished interference from water. This results in more accurate measurements than other online and inline spectroscopic and non-spectroscopic analysis techniques.
High chemical specificity to critical process parameters and versatility to many applications: Raman fingerprint is unique to the molecule. Also, Raman spectroscopy can be used in a lot of different applications in bioprocessing – the possibilities are endless.
Qualitative and quantitative analysis: It can do qualitative analysis such as detection of glycosylation or detection of a certain molecule. It can also do quantitative analysis to determine concentrations of different molecules.
Scalable easy tech transfer from lab to pilot to manufacturing: Models can be transferable between different scales with minimal adjustment to the model needed.

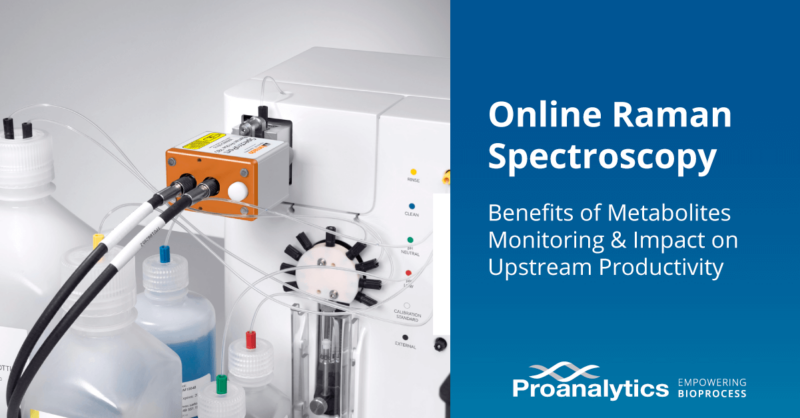
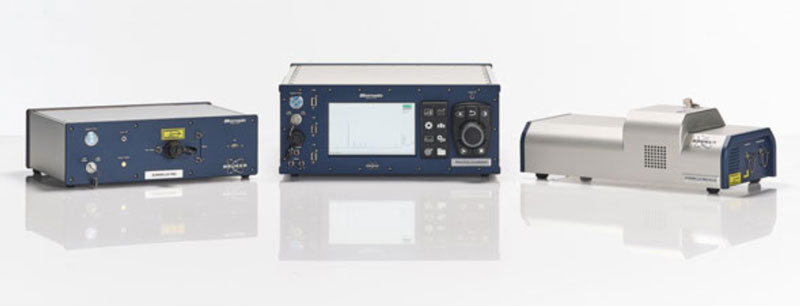
Non-invasive measurement capabilities, significantly reducing contamination risks while enabling remote process monitoring. Immersion probes, such as those from Tornado/Bruker, can be inserted into bioreactors. These probes are equipped with an autoclavable sheath, ensuring they maintain non-invasive contact. The spectrometer, like the HyperFlux Pro Plus or Process Guardian from Tornado/Bruker, remains outside the bioreactor, connected to the probe via a fiber optic cable. These cables can vary in length, from a few feet to several kilometers, allowing for fully remote process monitoring. Additionally, non-contact Raman probes are available for measuring solid particles or powder beds, and microflow cell probes can be used with perfusion systems, further enhancing their application flexibility.
Continuous monitoring enables process control, optimization and corrections from deviations in real time. It allows the development of predictive and advanced feedback control strategies, increasing the productivity and quality.
Higher process efficiency and product concentration, better and more consistent product quality: With continuous monitoring and process optimization, the process efficiency , product concentration and/or product quality and yield can be significantly improved.
Shorter cycle times: As the process optimization can be done faster, the time required to go from smaller scales to larger scales can be significantly reduced, leading to shorter process cycle times.
Lower costs are achieved due to reduced calibration efforts for different scale bioreactors.
Compatible with different process automation platforms: Tornado/Bruker Raman spectroscopy systems have OPC UA and Modbus TCP communication protocols, which allows Raman data integration onto different automation platforms. A prediction engine gives real-time predictions of the molecules’ concentrations, and these predictions can be streamed to other software platforms very easily.
Key Biomolecules Detected by Raman Spectroscopy
It has been demonstrated that Raman spectroscopy could possibly measure the below molecules with correct mathematical models:
- Amino acids like alanine, arginine, glutamic acid (glutamate), glycine, histidine, proline, serine, tryptophan, tyrosine, valine, asparagine, glutamine, aspartic acid, cysteine, isoleucine, leucine, lysine, methionine, threonine and phenylalanine;
- DNA and RNA bases like adenine, cytosine, guanine, thymine and uracil;
- Fatty acids and fats like 12-methly-tetradecanoic acid, 13-methylmyrisitic acid, 14-methylmyrisitic acid, 14-methylhexadecanoic acid, 15-methylpalmitic acid, vaccenic acid, glycerol, lauric acid, myrisitic acid, oleic acid, palmitic acid, stearic acid, triolein, trilinolein and trilinolenin;
- Hormones like human growth hormone and insulin;
- Organic acids like acetate, formate, gluconic acid, keto-gluconic acid and lactate; primary metabolites like acetoacetate, acetylcoenzyme a, coenzyme a, fumarate, malic acid, phosphenolpyruvate, pyruvate, citric acid, succinic acid (succinate);
- Salts like magnesium sulfate, nitrate, potassium phosphate monobasic and sulfate;
- Sugars like N-acetyl-d-glucosamine, amylopectin, amylose, arabinose, cellulose, chitin, dextrose, d-fructose-6-phosphate, fucose, galactosamine, lactose, mannose, trehalose, xylose, fructose, glucose and sucrose;
- Some other compounds like β-carotene, ascorbic acid, glutathione and riboflavin.
It has been also demonstrated that Raman spectroscopy could measure total cell density, viable cell density, product titer, viability, antibody titer, and osmolality.
Raman spectrum is used in microbial fermentation systems that use Saccharomyces cerevisiae, Gibberella fujikuroi, Lactobacillus casei, Phaffia rhodozyma, Escherichia coli and microalgae, and cell culture systems using CHO, HEK293 and NS0 cell lines.
In summary, online Raman spectroscopy systems from Tornado/Bruker are utilized in many applications. Applying the right modeling, these systems provide and a rapid and user-friendly way for process characterization, monitoring and control of upstream bioprocess.
References
If you are interested in learning more, please check the literature below and contact ProAnalytics.
- Goldrick, S.; Umprecht, A.; Tang, A.; Zakrzewski, R.; Cheeks, M.; Turner, R.; Charles, A.; Les, K.; Hulley, M.; Spencer, C.; Farid, S.S. High-Throughput Raman Spectroscopy Combined with Innovate Data Analysis Workflow to Enhance Biopharmaceutical Process Development. Processes 2020, 8, 1179. doi: 10.3390/pr8091179
- Esmonde-White, K.A., Cuellar, M., Uerpmann, C. et al. Raman spectroscopy as a process analytical technology for pharmaceutical manufacturing and bioprocessing. Anal Bioanal Chem 409, 637–649 (2017). doi: 10.1007/s00216-016-9824-1
- Buckley K, Ryder AG. Applications of Raman Spectroscopy in Biopharmaceutical Manufacturing: A Short Review. Applied Spectroscopy. 2017;71(6):1085-1116. doi:10.1177/0003702817703270
- Sibley, M. et al. “Novel Integrated Raman Spectroscopy Technology for Minibioreactors Accelerating Raman Model Building for Cell Culture Monitoring and Control.” (2020).
- Abu-Absi, Nicholas & Martel, Richard & Lanza, Amanda & Clements, Stacey & Borys, Michael & Li, Zheng Jian. (2014). Application of spectroscopic methods for monitoring of bioprocesses and the implications for the manufacture of biologics. Pharmaceutical Bioprocessing. 2. 267-284. 10.4155/pbp.14.24.
- Kögler, M. (2018). Advanced Raman Spectroscopy for Bioprocess Monitoring: Dissertation. doi: 10.14279/depositonce-6684
- Ryabchykov, Oleg, Guo, Shuxia and Bocklitz, Thomas. “Analyzing Raman spectroscopic data” Physical Sciences Reviews, vol. 4, no. 2, 2019, pp. 20170043. doi: 10.1515/psr-2017-0043
- Banner image illustration source: Silvère André, Lydia Saint Cristau, Sabine Gaillard, Olivier Devos, Éric Calvosa, Ludovic Duponchel, In-line and real-time prediction of recombinant antibody titer by in situ Raman spectroscopy, Analytica Chimica Acta, Volume 892, 2015, Pages 148-152, ISSN 0003-2670, https://doi.org/10.1016/j.aca.2015.08.050.